Volatility Analytics
Volatility Surface Guide: Skew, Smile, and Term Structure in One View
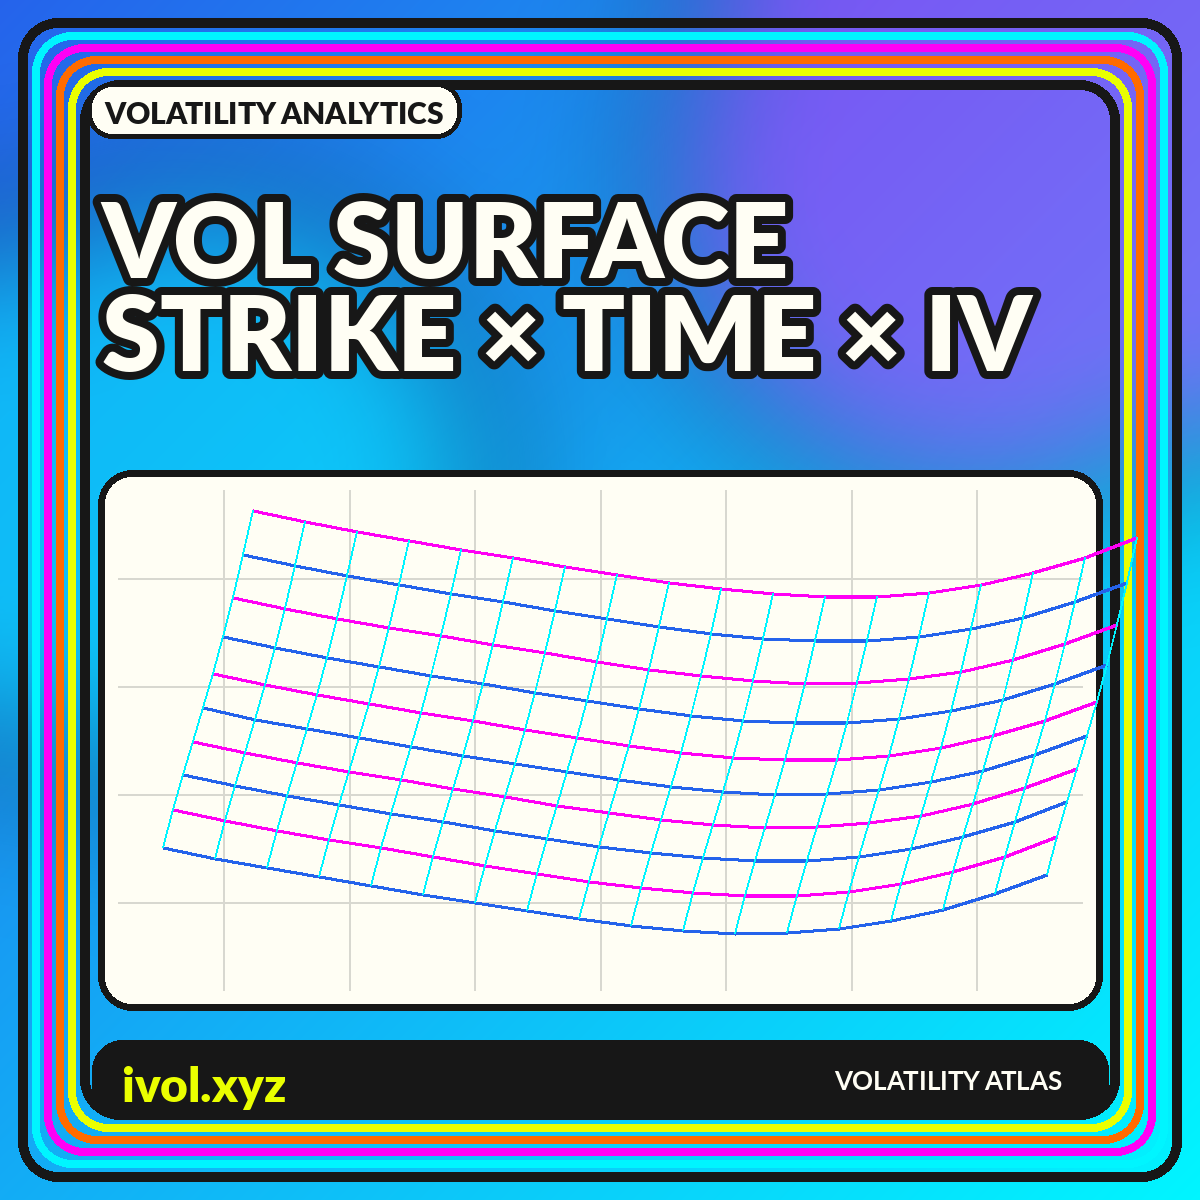
A volatility surface maps implied volatility across strike and expiration. Learn what the shape reveals and how to visualize it without hiding the method.
Volatility compared across expiration dates and constant-maturity horizons.
A volatility surface maps implied volatility across strike and expiration. Learn what the shape reveals and how to visualize it without hiding the method.
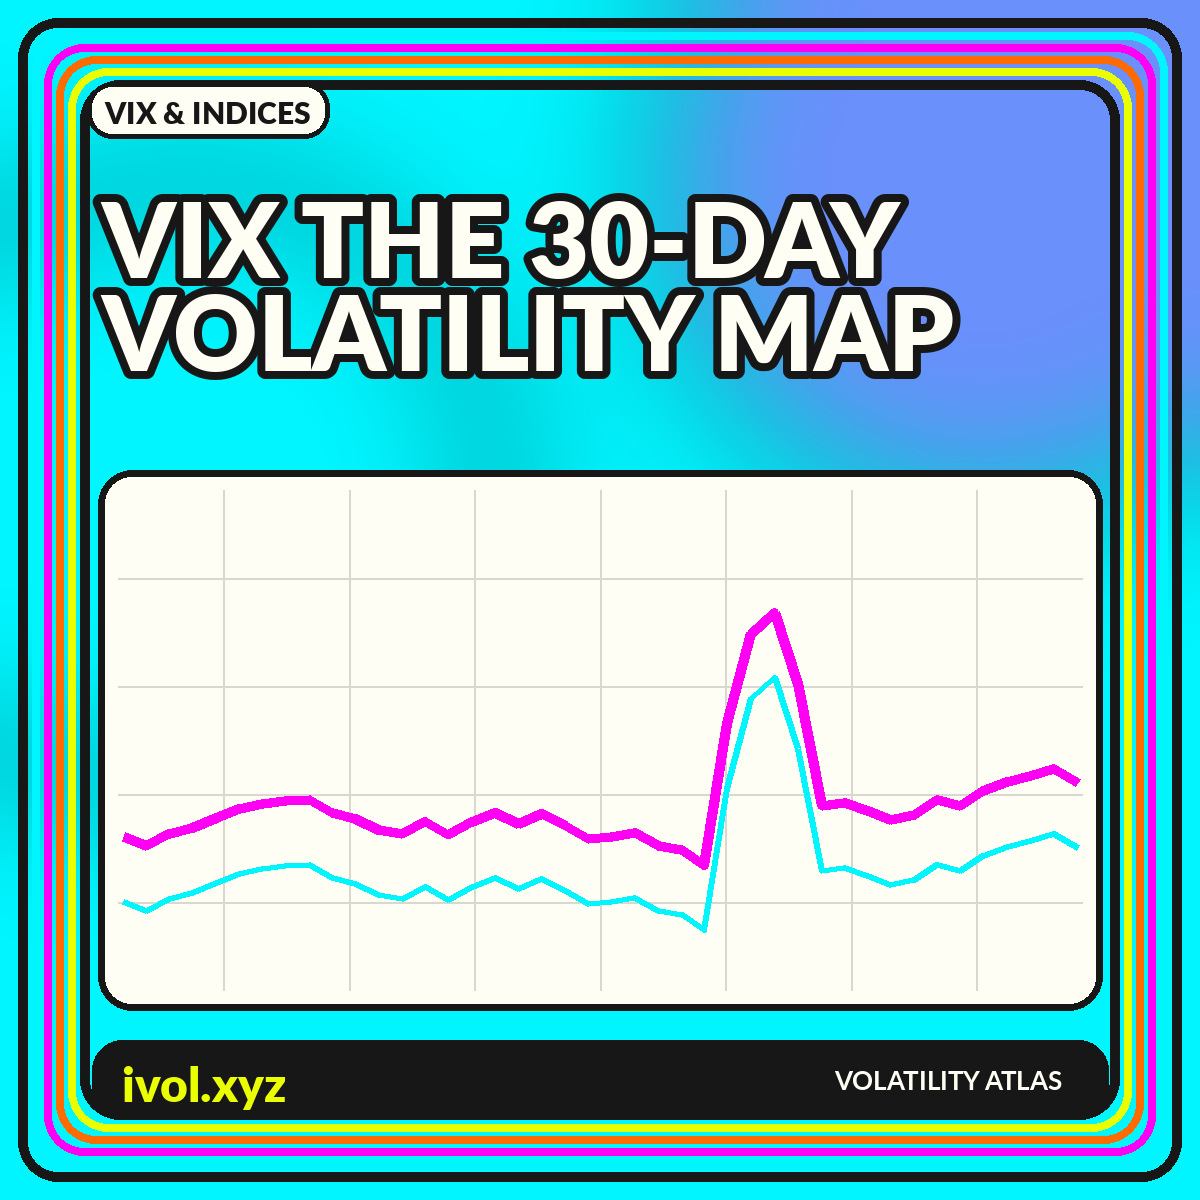
A visual guide to the VIX: its SPX option inputs, constant 30-day horizon, term structure, chart patterns, and interpretation limits.