VIX-Linked Products: Why Spot VIX and Product Returns Diverge
A VIX-linked product usually follows a futures index, not spot VIX. Understand curve shape, roll, compounding, fees, and issuer structure before comparing returns.
Long-form, methodology-aware articles about implied volatility, VIX, trading volume, volume profile, footprint charts, volatility surfaces, regimes, and cross-asset risk.
Begin with range and index basics, move through volume and order flow, then build toward surfaces, regimes, cross-asset maps, and product mechanics.
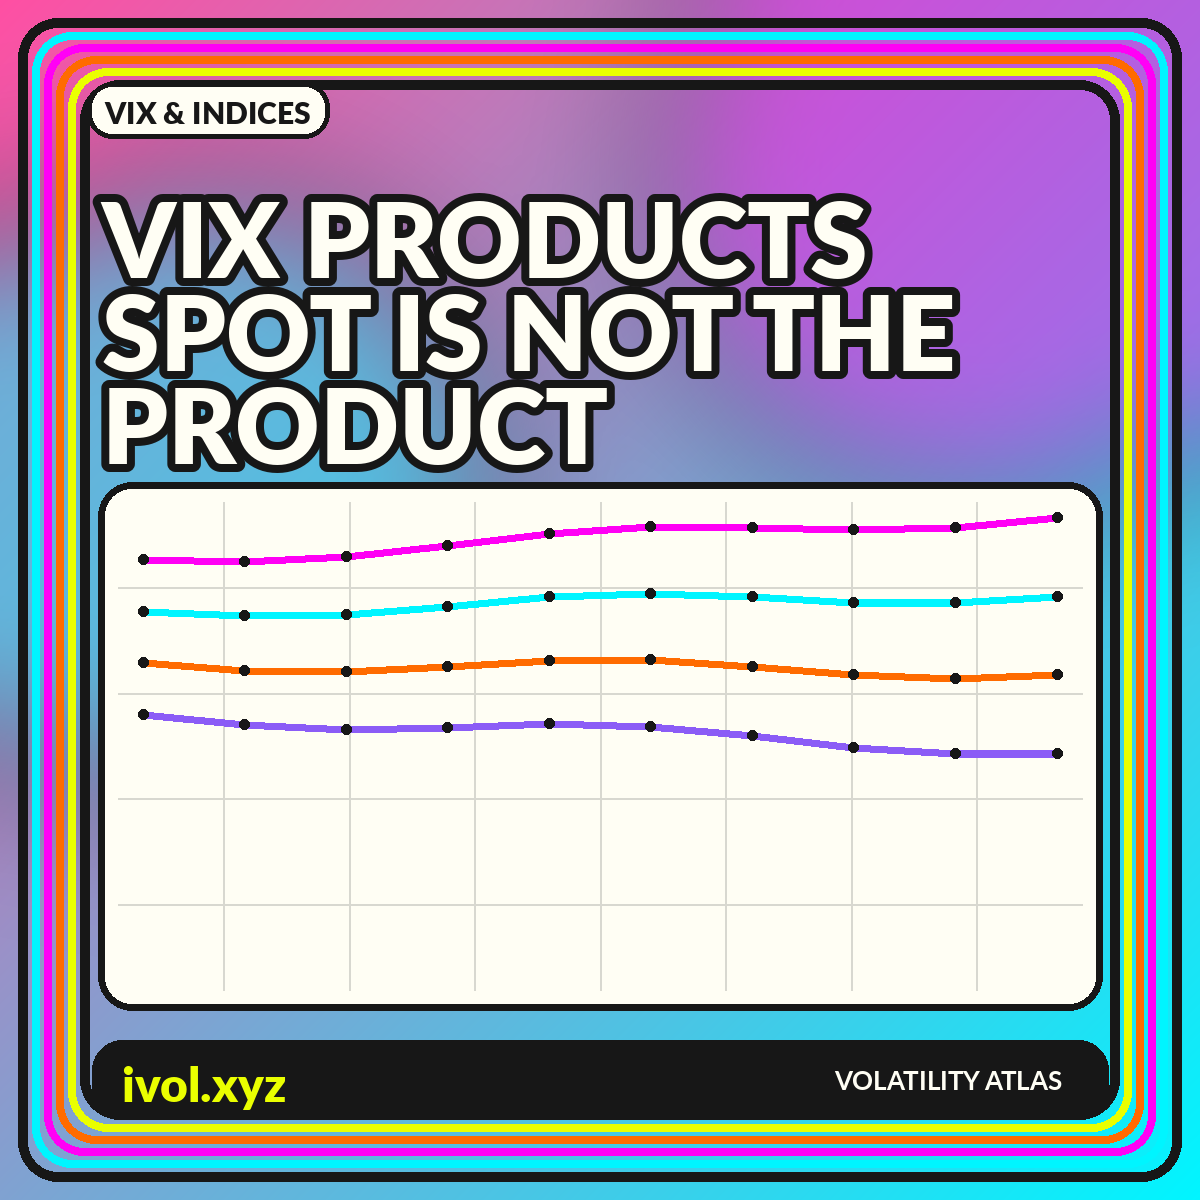
A VIX-linked product usually follows a futures index, not spot VIX. Understand curve shape, roll, compounding, fees, and issuer structure before comparing returns.
Cross-asset volatility charts can reveal shared stress and local shocks, but only after units, horizons, calendars, and index methodologies are aligned.
Large moves tend to arrive in groups. Explore rolling volatility, autocorrelation, regime bands, transitions, and the uncertainty behind every state label.
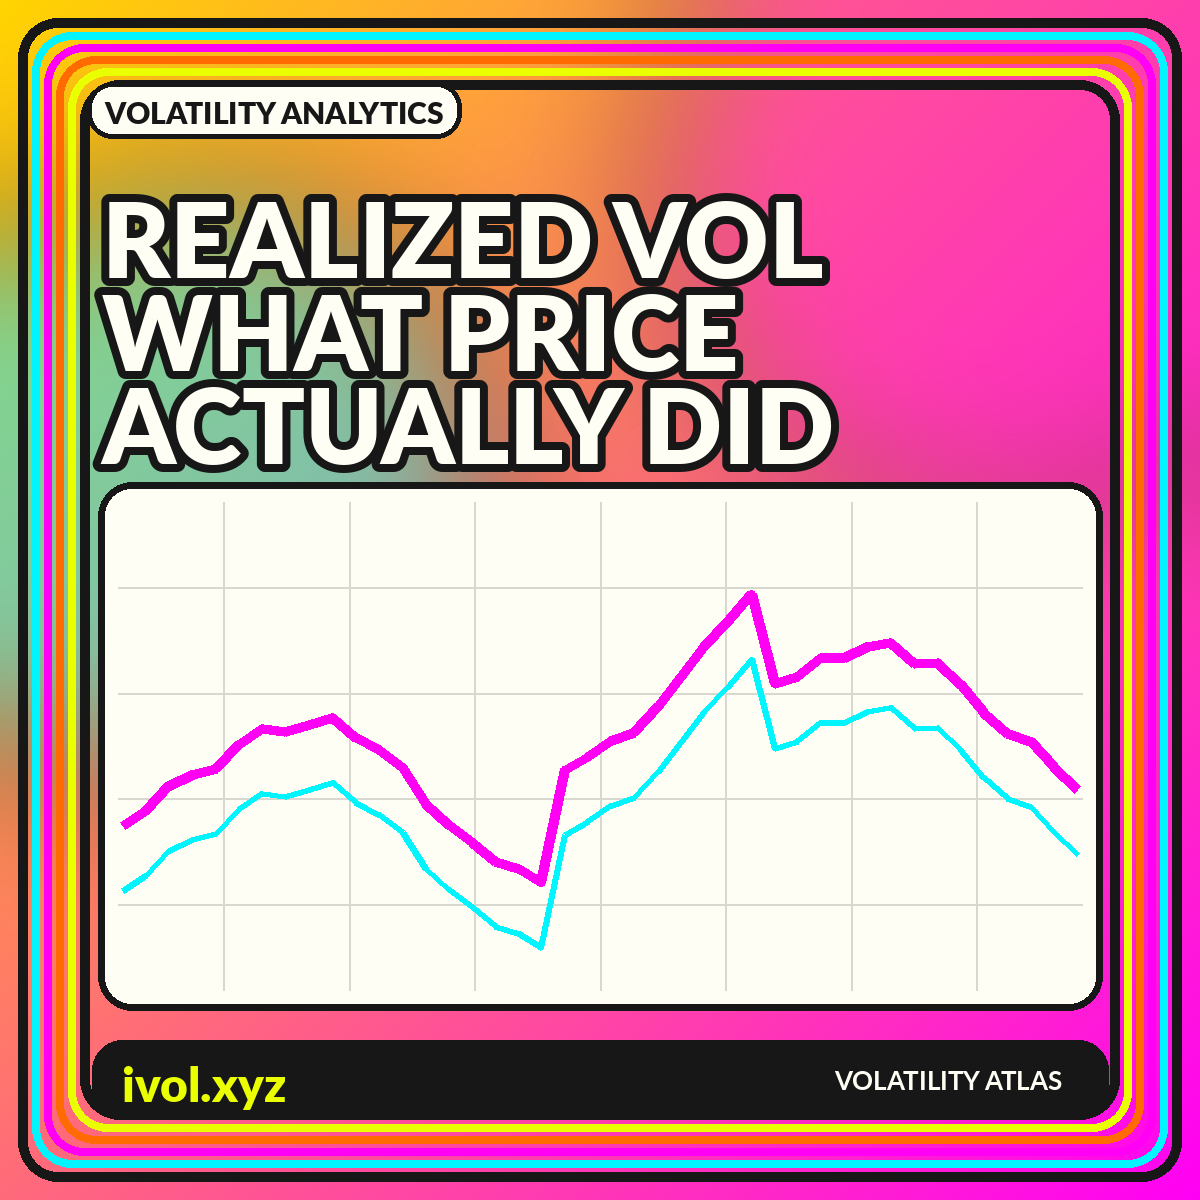
Realized volatility summarizes observed return variation, but the chart depends on window, sampling, estimator, session, and annualization choices.
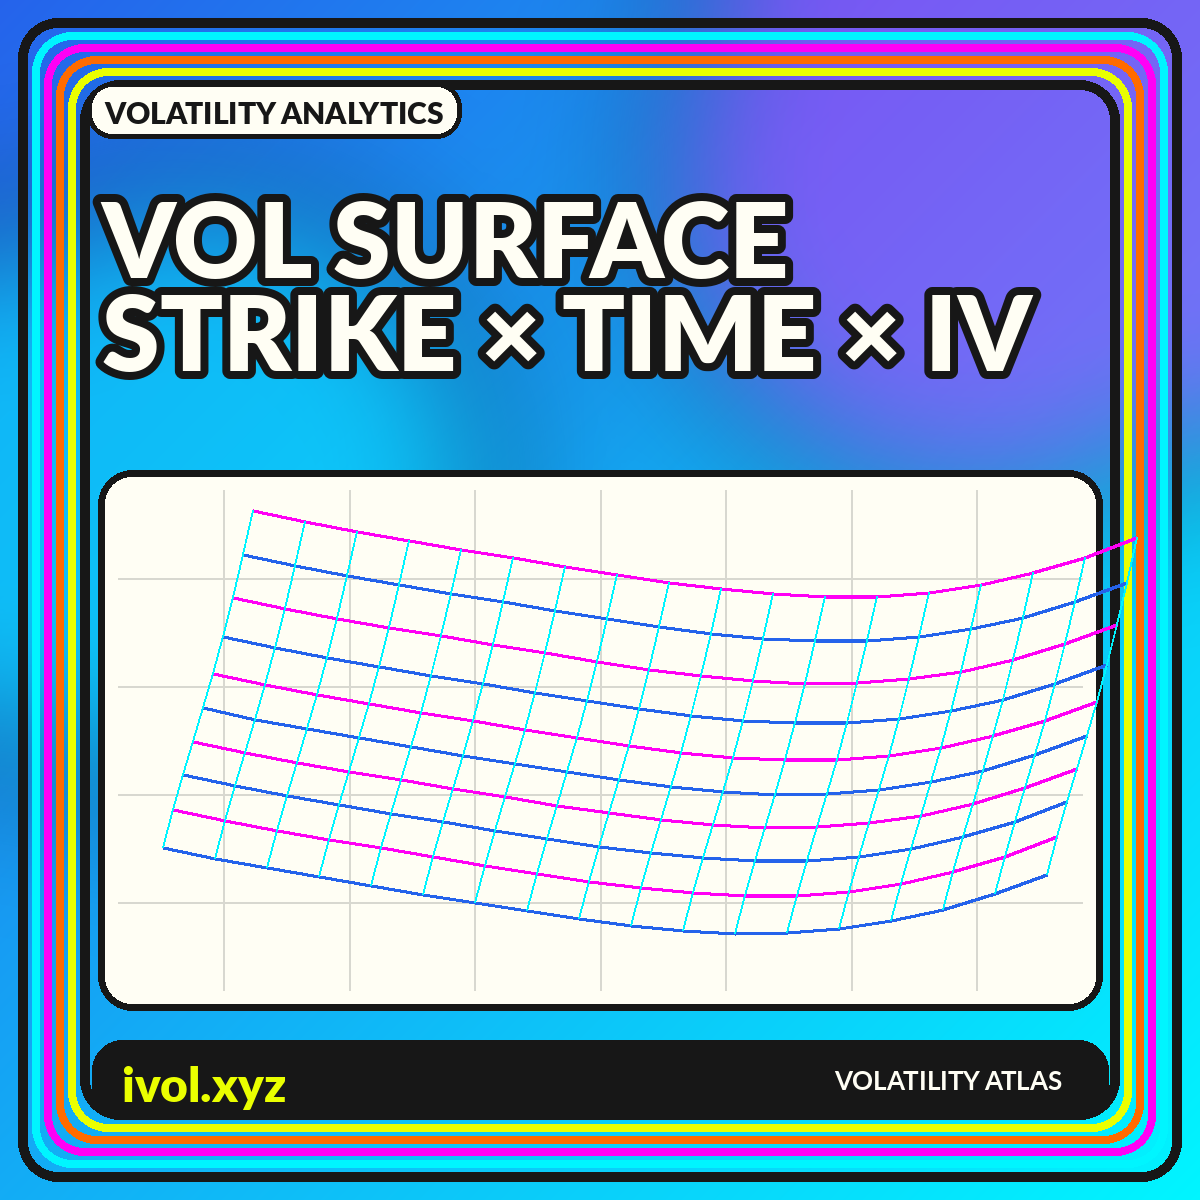
A volatility surface maps implied volatility across strike and expiration. Learn what the shape reveals and how to visualize it without hiding the method.
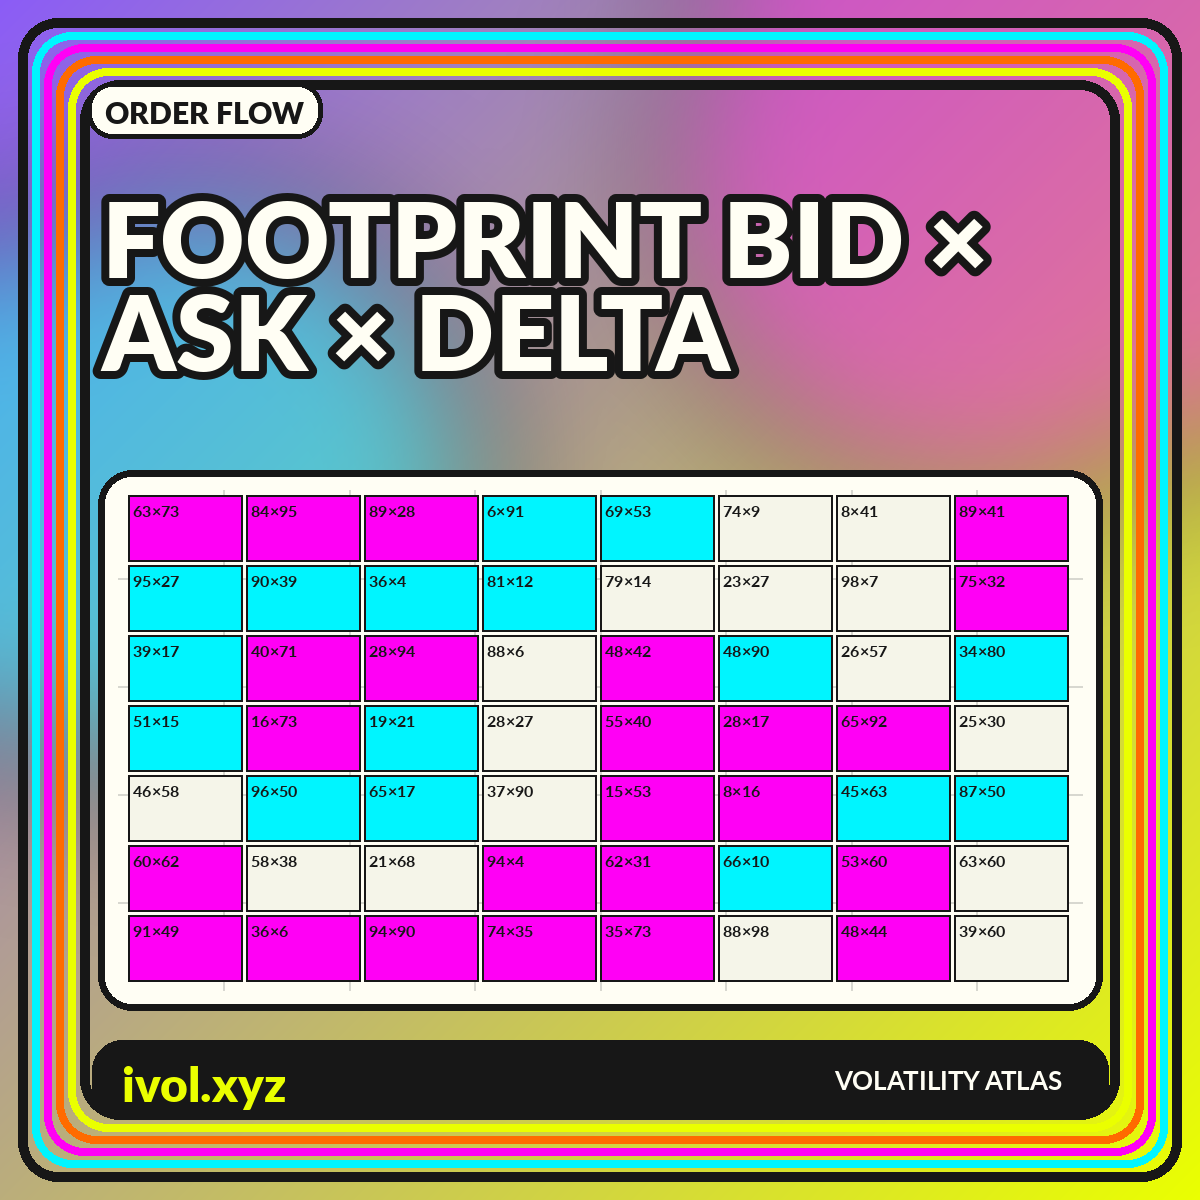
Footprint charts place volume inside each price bar. Learn what bid/ask cells, delta, and imbalance show—and what they cannot prove about market intent.
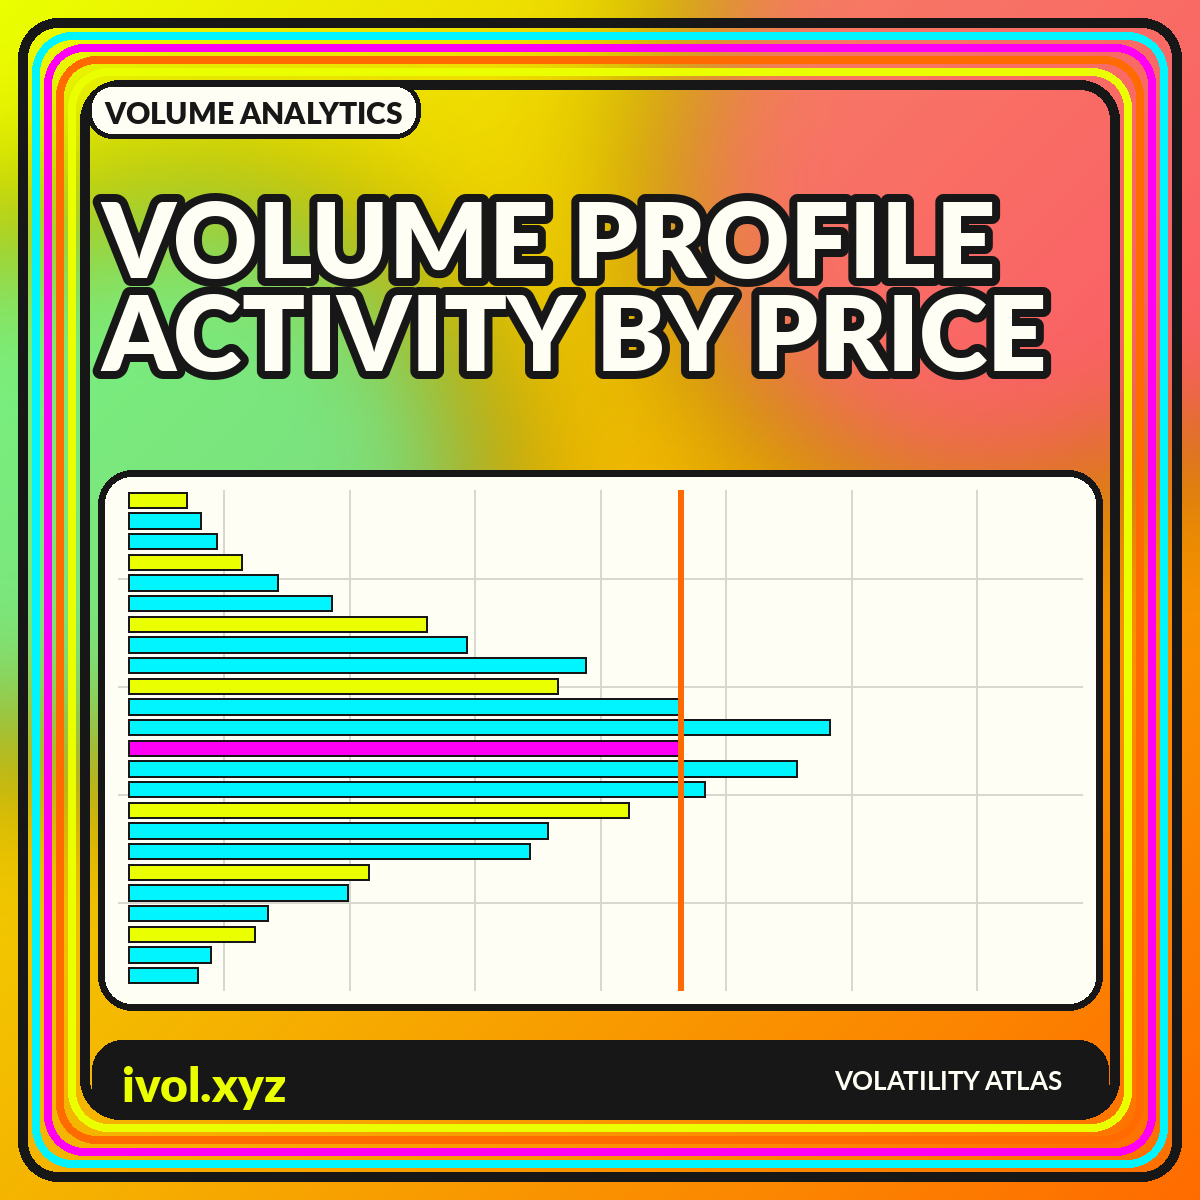
Volume profile rotates the usual histogram: instead of volume by time, it maps activity by price. Here is how to read the shape and its limits.
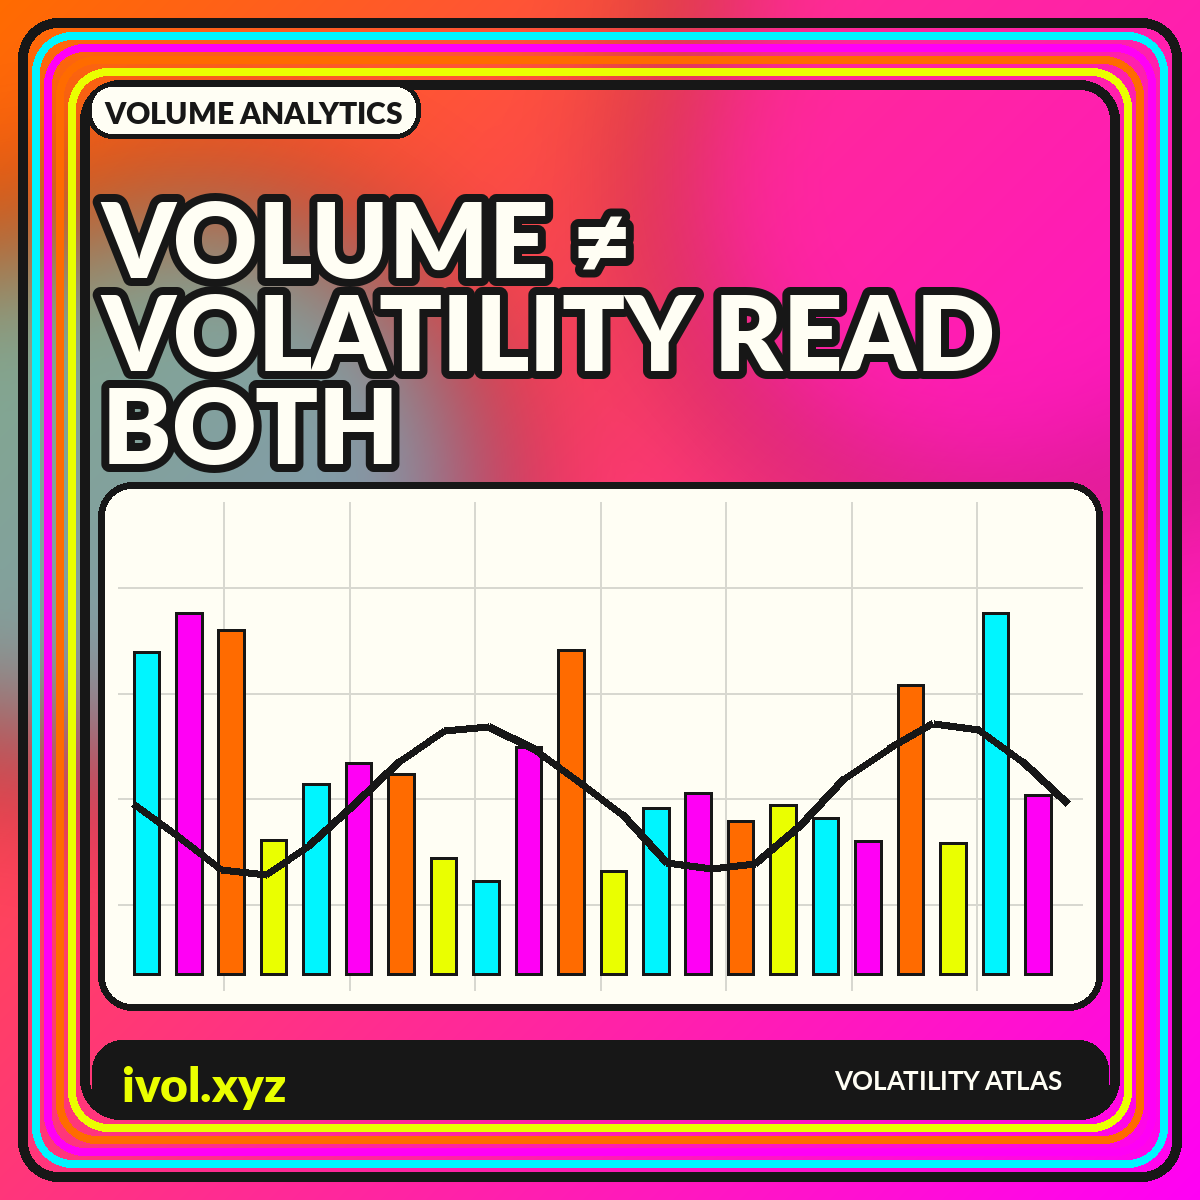
Volume counts activity; volatility describes price variation. Learn when they move together, when they diverge, and how to chart both without confusing causation.
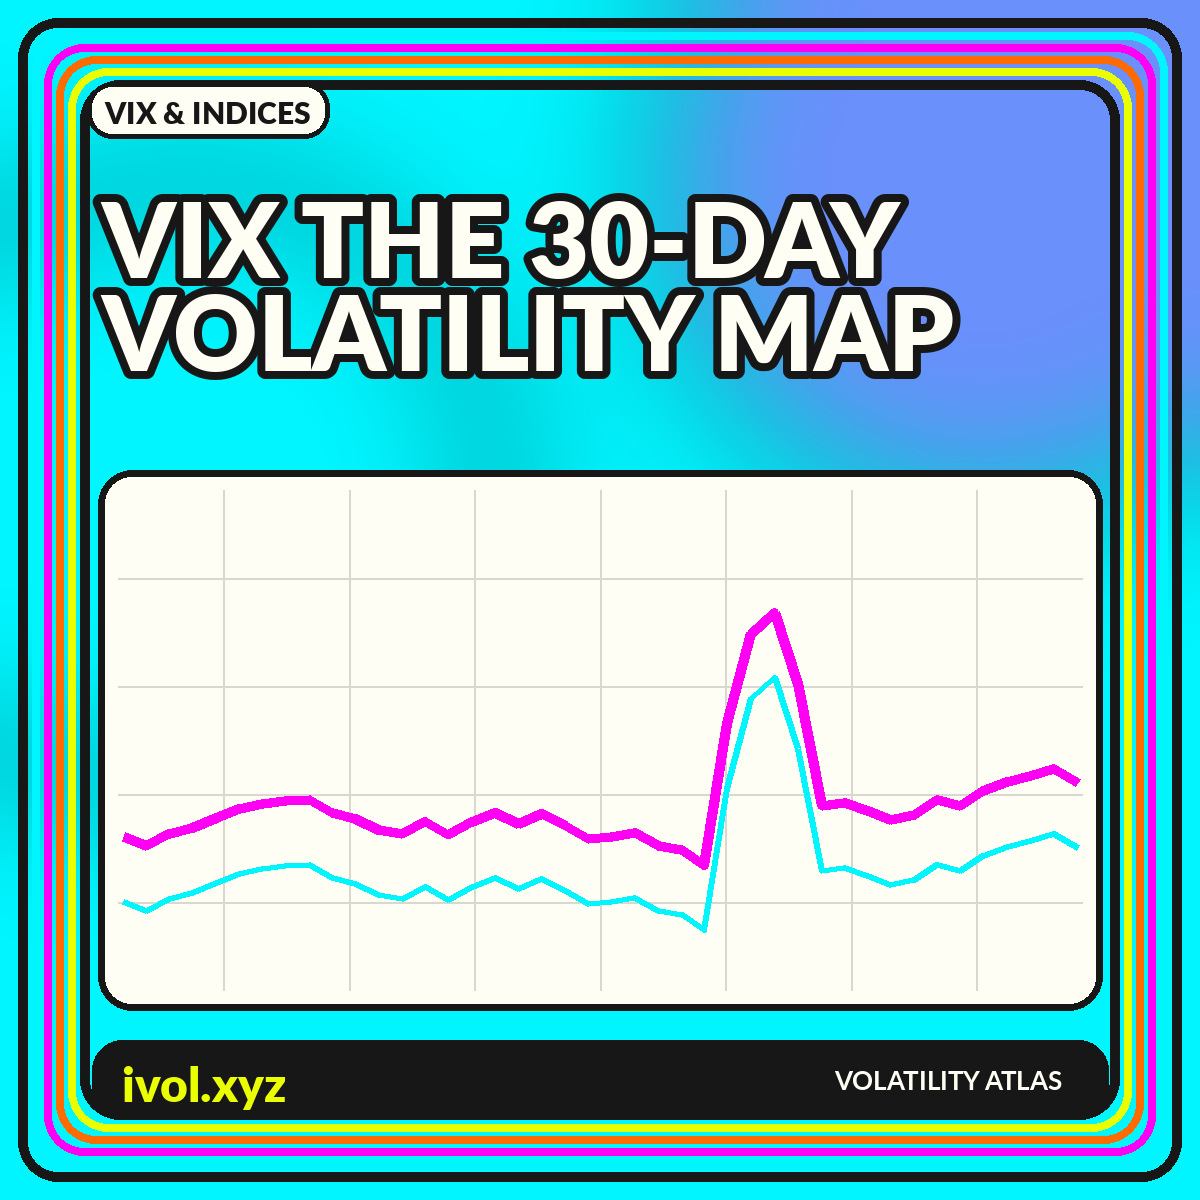
A visual guide to the VIX: its SPX option inputs, constant 30-day horizon, term structure, chart patterns, and interpretation limits.
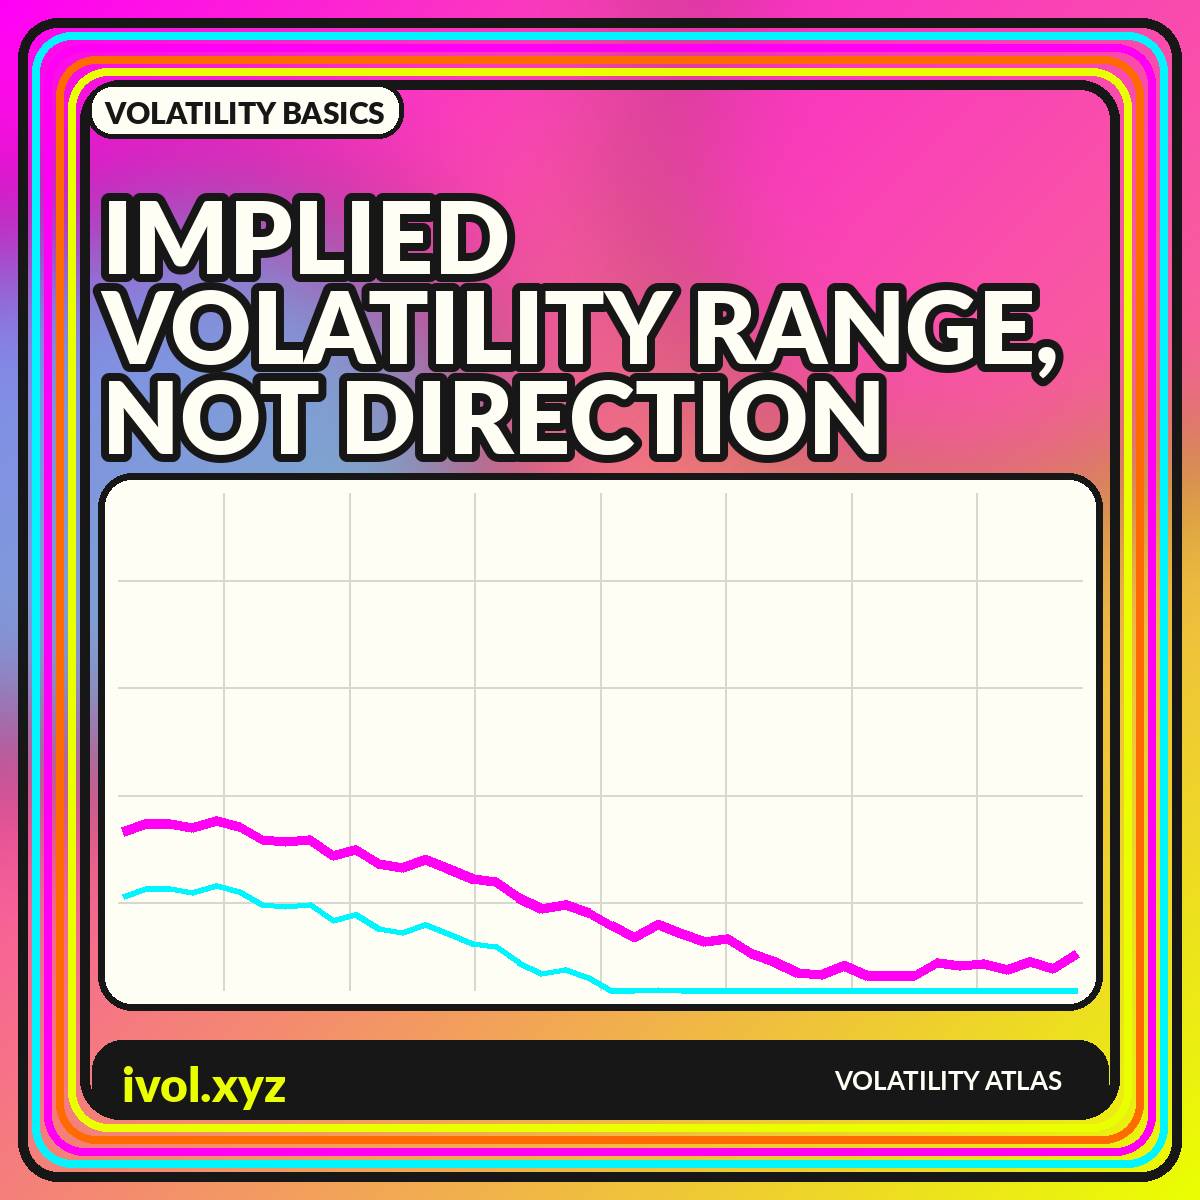
A chart-first guide to what implied volatility says, what it leaves unsaid, and how to compare it across expirations, strikes, and market regimes.
Category archives group guides by analytical task rather than by market hype.
Foundational guides to implied volatility, expected ranges, and the language used to describe market uncertainty.
2 guidesMethodology-aware guides to VIX, volatility index term structures, and futures-linked exposures.
2 guidesCharts that organize trading activity through time and across price, with careful attention to units and data coverage.
1 guideGranular views of executed trading, including volumetric bars, delta, and imbalance visualization.
2 guidesAdvanced visual frameworks for realized volatility, surfaces, skew, and term structure.
1 guideWays to identify persistence, clustering, state transitions, and uncertainty around regime labels.
1 guideComparisons that align volatility measures across equities, rates, currencies, commodities, and portfolios.