History
Lines and small multiples for realized volatility, implied volatility, returns, drawdown, and persistence.
Choose the geometry that matches the measurement: lines for history, profiles for distributions, surfaces for option shape, and heatmaps for breadth.
The right visualization preserves the dimensionality of the measurement instead of flattening every question into one line.
Lines and small multiples for realized volatility, implied volatility, returns, drawdown, and persistence.
Histograms, percentiles, expected ranges, volume profiles, and event-window outcomes.
Skew curves, term structures, surfaces, contours, and observed-versus-fitted residuals.
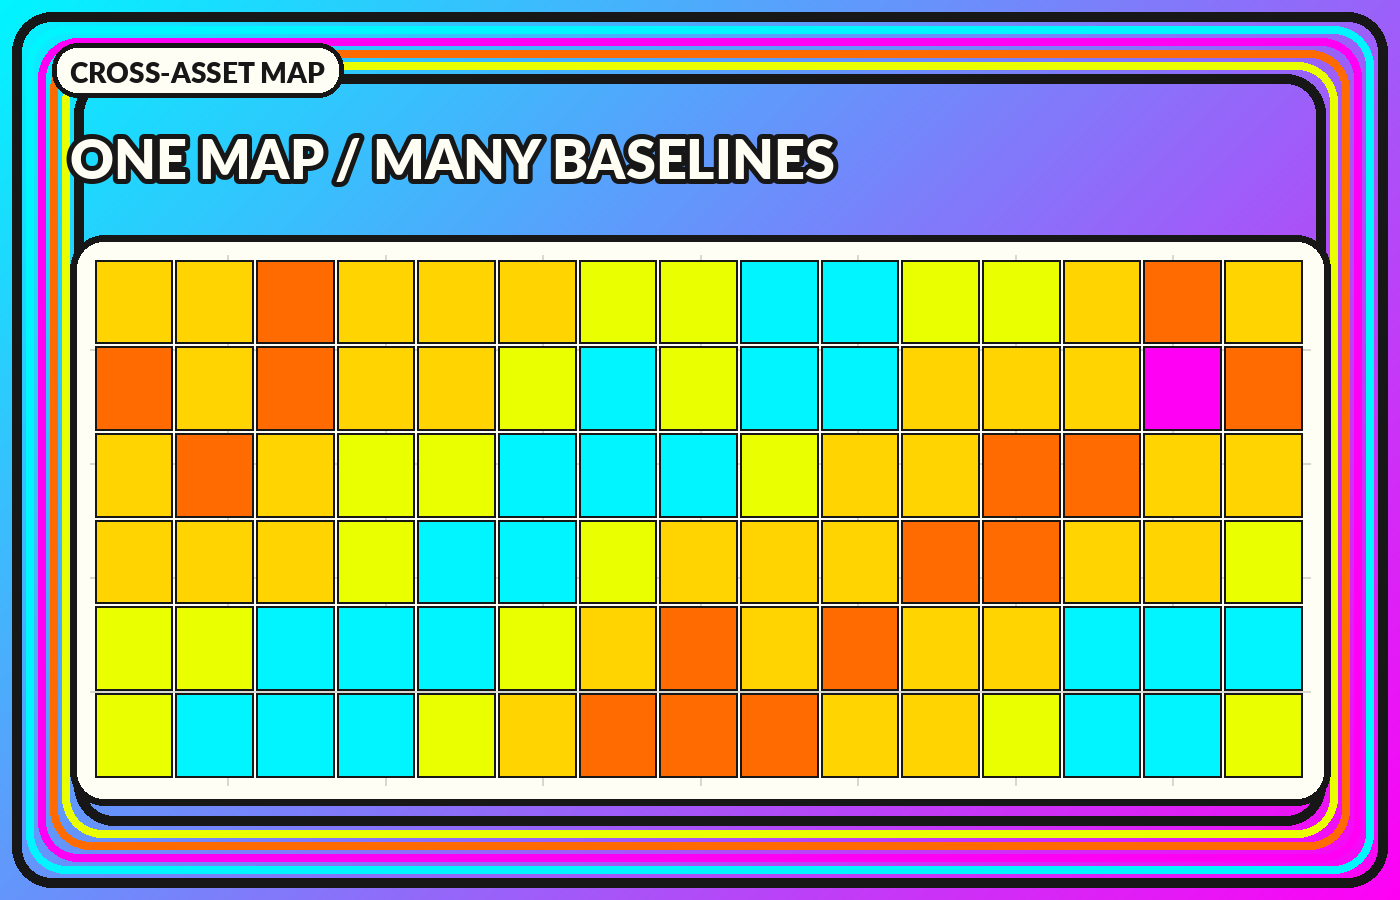
Heatmaps, state probabilities, cross-asset breadth, transition matrices, and duration views.
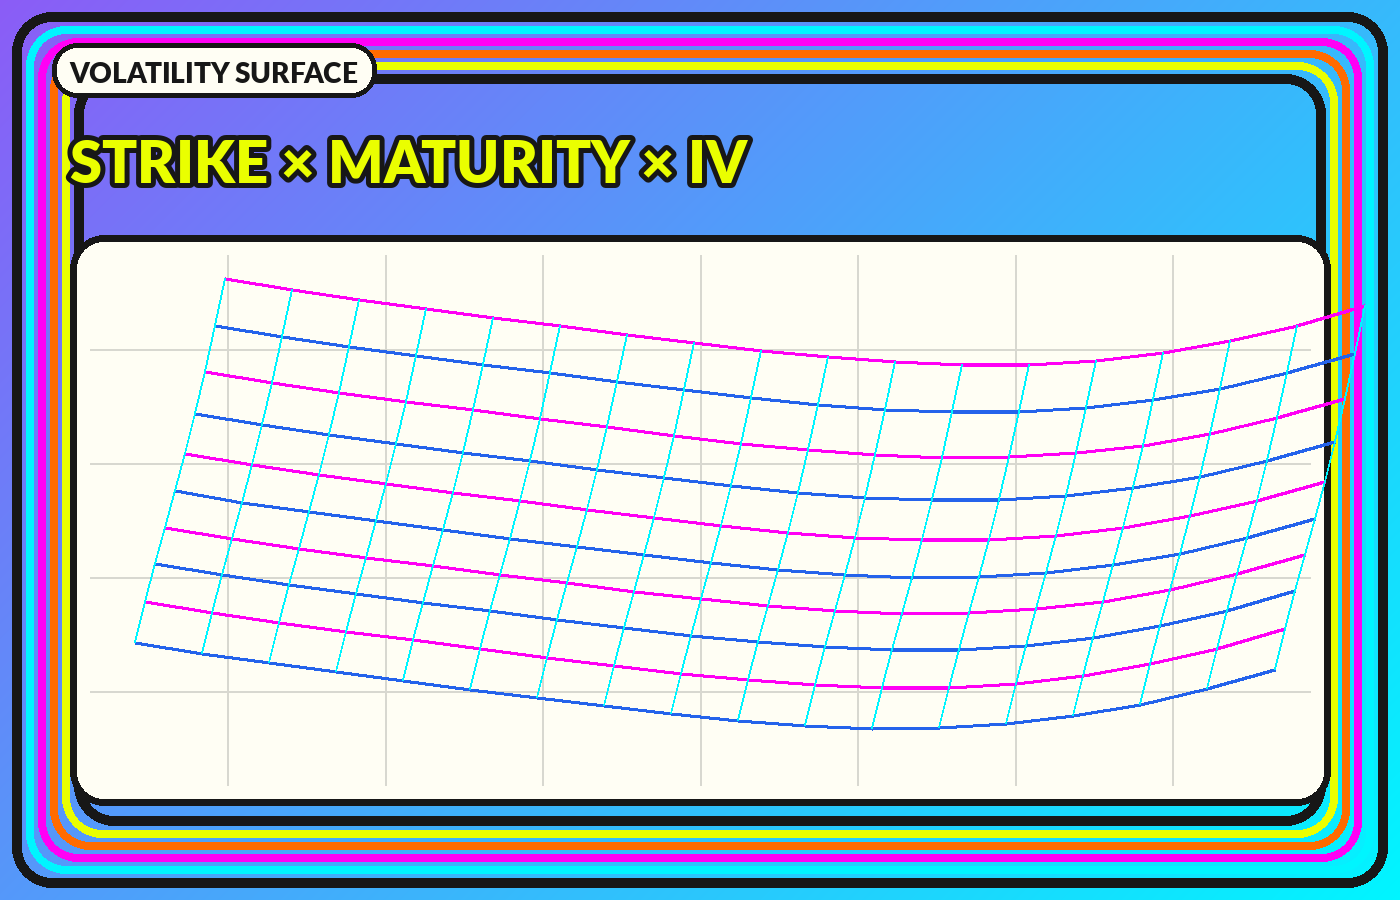
A surface combines skew and term structure. The continuous mesh is an interpolation, so observed option nodes and modeled regions should remain distinguishable.
Normalize for comparison, preserve raw units for meaning, and keep missing observations separate from calm values.
Use fixed scales for comparison. Automatic rescaling can manufacture dramatic differences. Synchronize time. A shared cursor and UTC timestamps reduce false lead-lag stories. Expose the method. Show windows, filters, interpolation, source coverage, and delay. Design for export. Dates and units should survive when a chart is copied into a report.
Do not use color alone. Pair hue with labels, patterns, line styles, or table fallbacks. Maintain keyboard access for interactive controls, readable focus states, and sufficient contrast. On mobile, stack panels instead of shrinking a complex dashboard into illegible miniatures.
Model probabilities, residuals, bid-ask ranges, sensitivity bands, and missing data are part of the result. A polished surface or regime color should not hide uncertainty about the input or classification.