Spot index
A constant 30-day option-derived measure. It cannot be purchased directly and does not forecast equity direction.
The VIX is a precise option-derived index with an imprecise nickname. Read the level, history, curve, and product chain without confusing range with direction.
The Cboe Volatility Index is designed to represent the market's 30-day expectation of S&P 500 volatility derived from SPX option prices. It is an option-derived index, not a moving average of historical returns. The constant horizon is created from eligible nearby expirations so the remaining time does not simply shrink each day.
VIX is often called the fear gauge, but the formula observes option prices rather than emotion. Hedging demand, event risk, liquidity, market making, and relative-value activity can all influence the inputs. A useful chart labels the index as priced uncertainty and avoids turning every increase into a directional equity forecast.
Fixed labels such as calm, normal, and panic can be convenient, but VIX distributions change across eras. Use rolling percentiles, medians, and several historical windows. Preserve crisis spikes rather than clipping the axis without disclosure, and annotate the dates that explain local changes.
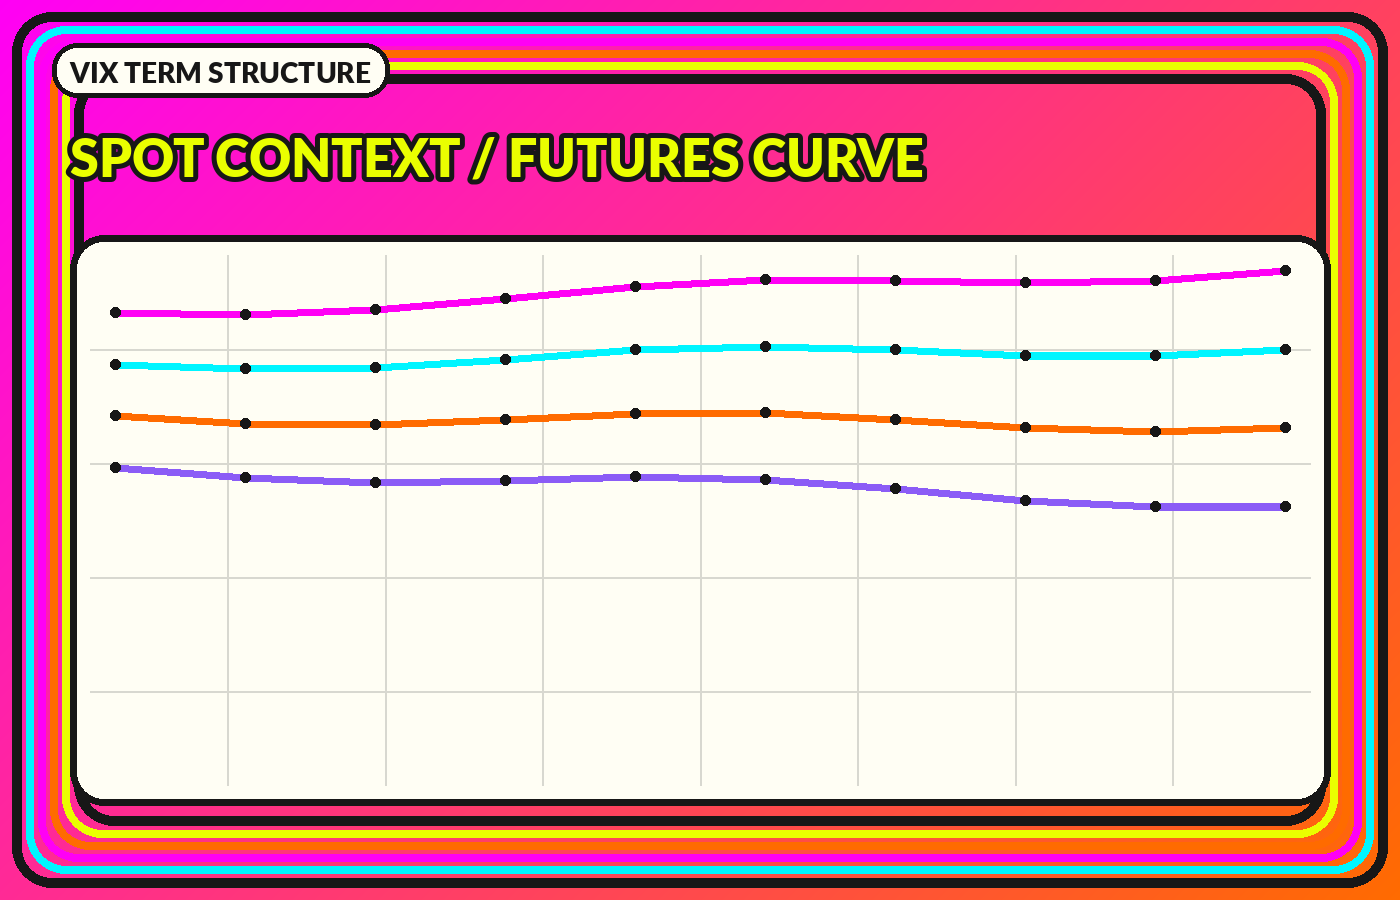
Spot VIX is a calculated index. VIX futures trade expectations for future settlement and can sit above or below spot. A curve in contango has later futures above nearer futures; backwardation describes the reverse. Curve shape is a state variable, not a guaranteed timing signal. Tradeable VIX-linked products commonly reference futures-based indexes, so product returns can diverge from spot.
Combine spot history, S&P 500 drawdown, short- and long-horizon volatility measures, the futures curve, and percentile context. Use synchronized panels rather than a dramatic dual axis. Show the observation timestamp and whether values are live, delayed, or end-of-day.
Spot VIX compresses a broad SPX option strip into one number. That compression is its strength—and its central limitation.
A futures or maturity curve reveals where uncertainty is concentrated in time. The same spot value can coexist with very different curves.
A constant 30-day option-derived measure. It cannot be purchased directly and does not forecast equity direction.
Tradeable contracts with their own maturities, settlement, basis, and curve dynamics.
ETFs or ETNs may track rolling futures indexes, sometimes with daily leverage or inverse exposure.
No. VIX describes the option market's pricing of 30-day volatility, not the direction or timing of the S&P 500.
The move may resolve uncertainty that was previously priced, or the decline may be smaller than option markets anticipated. VIX and equity returns are often inversely related, not mechanically linked.
Most products reference VIX futures or futures indexes. Roll, curve shape, daily reset, fees, premiums, and product structure affect returns.