Volume Analytics
Volume Profile Chart Guide: Mapping Trading Activity by Price
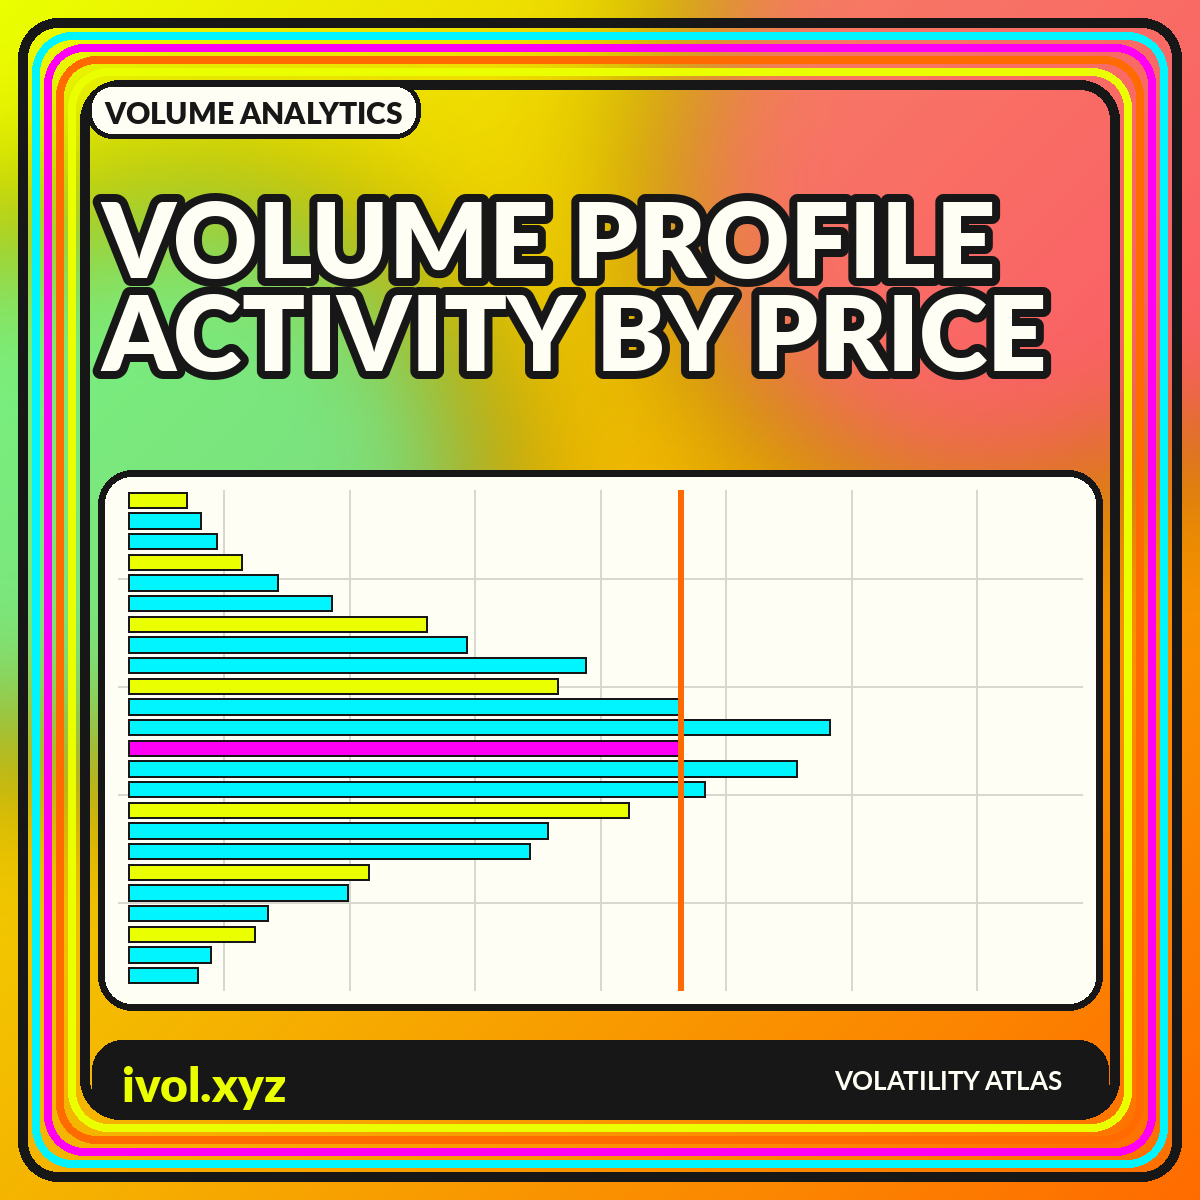
Volume profile rotates the usual histogram: instead of volume by time, it maps activity by price. Here is how to read the shape and its limits.
Charts that organize trading activity through time and across price, with careful attention to units and data coverage.
Volume profile rotates the usual histogram: instead of volume by time, it maps activity by price. Here is how to read the shape and its limits.
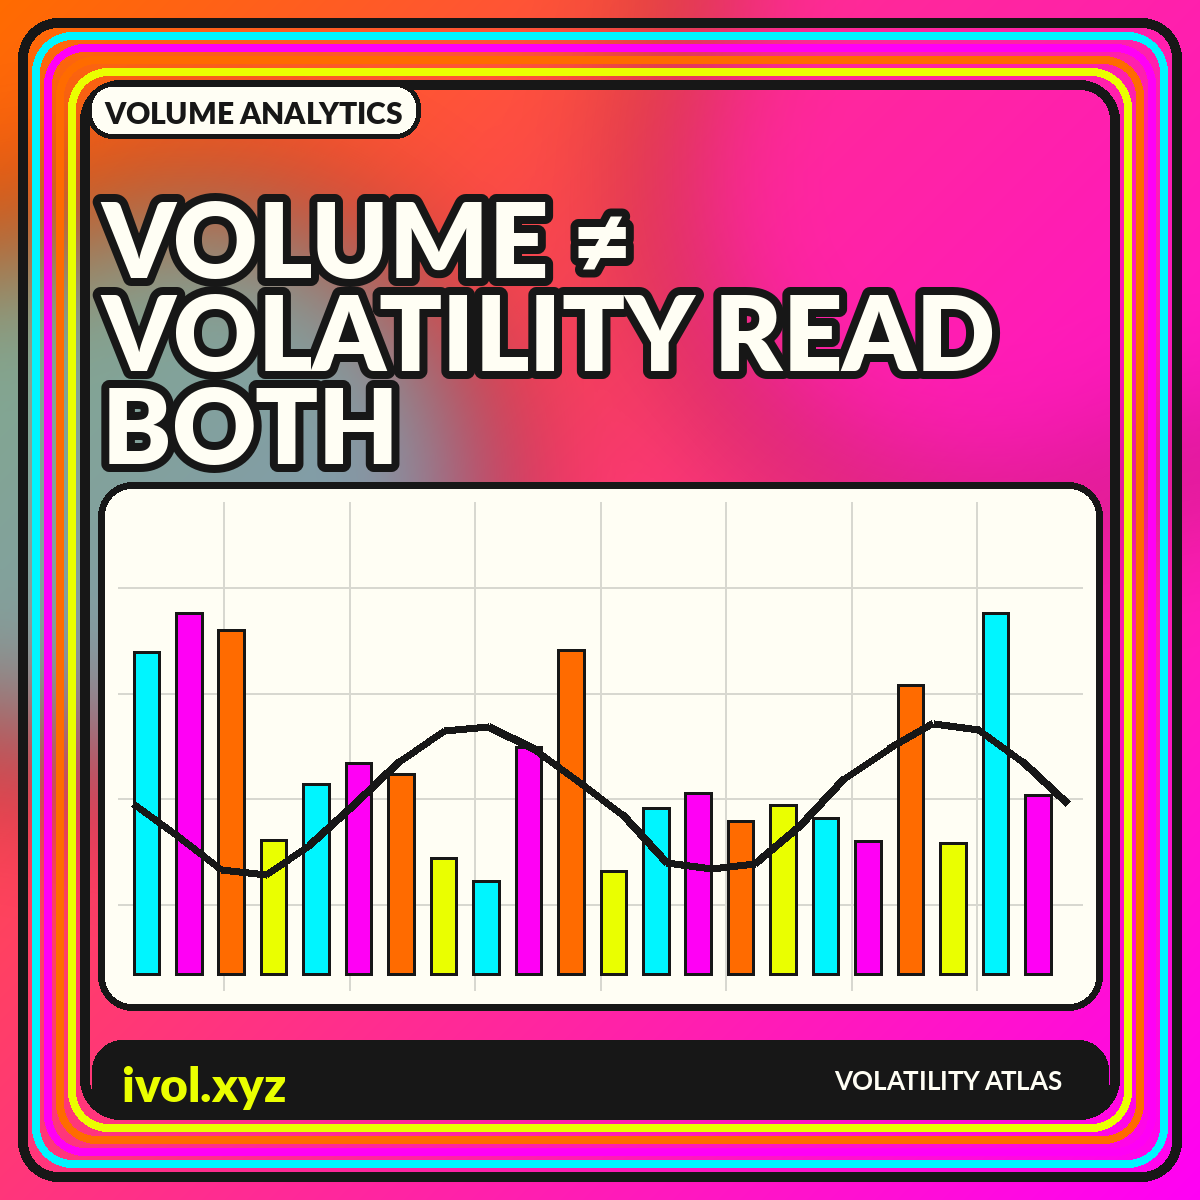
Volume counts activity; volatility describes price variation. Learn when they move together, when they diverge, and how to chart both without confusing causation.