Time
When did activity occur? Use volume bars, intraday seasonality, and event markers.
Volume counts transactions. The chart determines whether you see activity through time, across price, or inside each bar—and which assumptions stay hidden.
Trading volume counts shares, contracts, units, or notional value traded during an interval under a specific reporting convention. It does not identify the motive of participants and does not prove whether the market is bullish or bearish. Every execution has a buyer and a seller; “buy volume” and “sell volume” require a classification method.
Place activity beneath price bars to show when transactions occurred. Compare with a rolling average or session pattern, and mark auctions, rolls, and early closes.
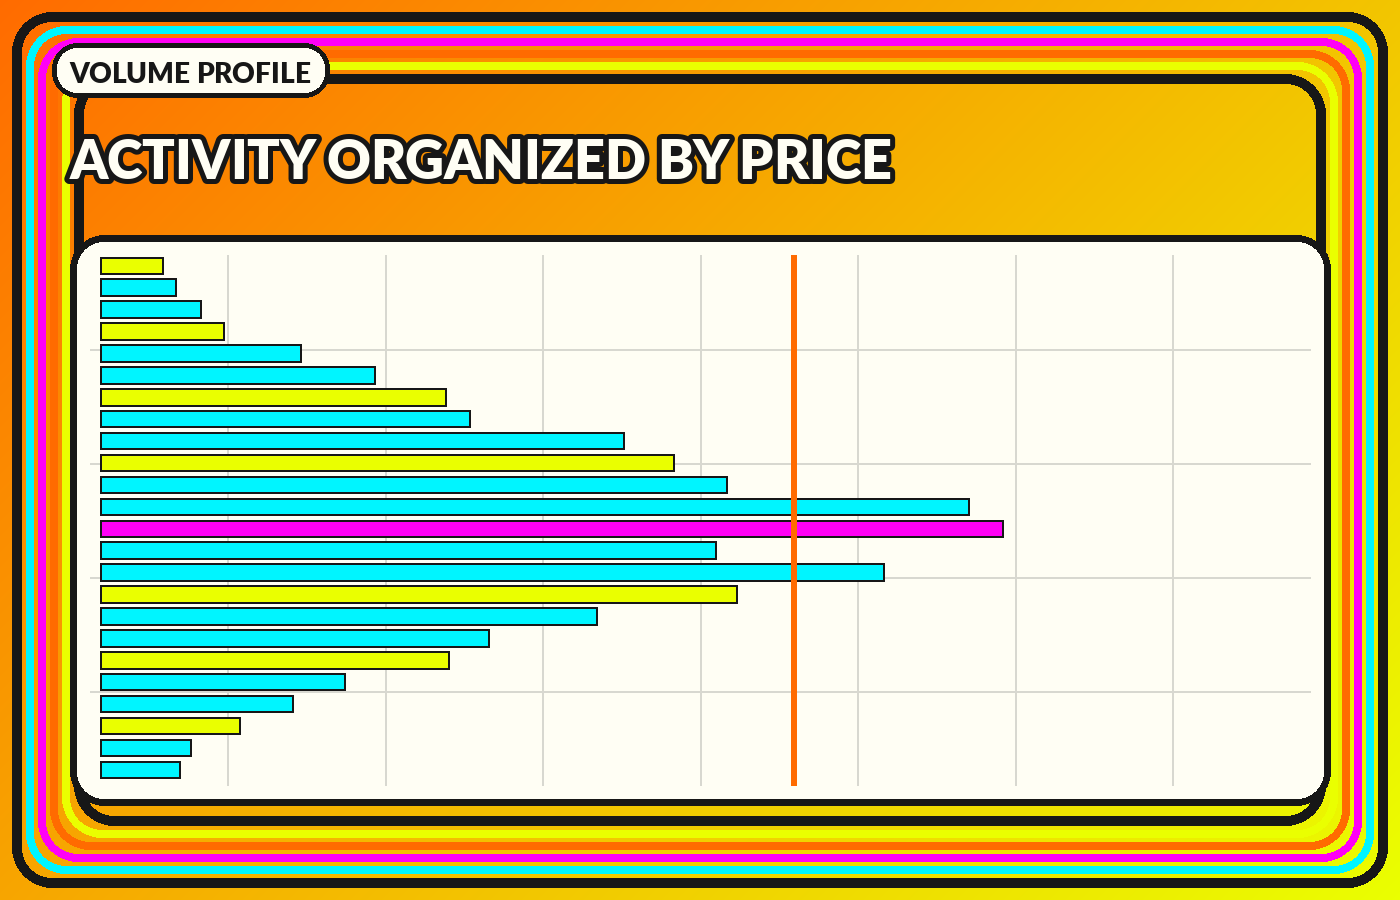
Rotate the distribution so volume accumulates by price. Point of control, value area, and nodes summarize a selected range, but the anchor, row size, and venue coverage determine the shape.
Display bid/ask-classified volume, delta, or imbalance inside each bar. These views require granular trade data and should state how aggressor side was determined.
Normalize volume before comparing instruments. Dollar volume, turnover, contract notional, and volume relative to a rolling average answer different questions.
Volume and volatility often rise together around information shocks, but they are not substitutes. High activity can occur near one price, while a thin market can move sharply on limited volume. Pair volume with range, spread, depth, returns, and volatility rather than using one series as a proxy for all market conditions.
Identify venue coverage, session boundaries, trade corrections, contract rolls, aggregation, and whether the feed is consolidated. A precise-looking profile from incomplete data can be less informative than a simple bar chart with transparent coverage.
Horizontal profiles reveal where volume accumulated inside a defined sample. The sample definition is part of the chart.
When did activity occur? Use volume bars, intraday seasonality, and event markers.
Where did activity accumulate? Use profiles, value areas, and sensitivity to row size.
How were trades classified? Use footprint cells, delta, and explicit data methodology.
High volume confirms that substantial activity occurred. Trend interpretation requires price path, liquidity, event context, and a defined method; volume alone is not directional.
No. Volume profile organizes traded volume by price. Traditional market profile organizes time or time-price opportunities by price.
They classify executions relative to quotes or exchange flags. They do not reveal participant identity, motive, or whether a position opened or closed.