Time series
Best for level, persistence, spikes, rolling windows, and comparison with returns. Keep window and annualization visible.
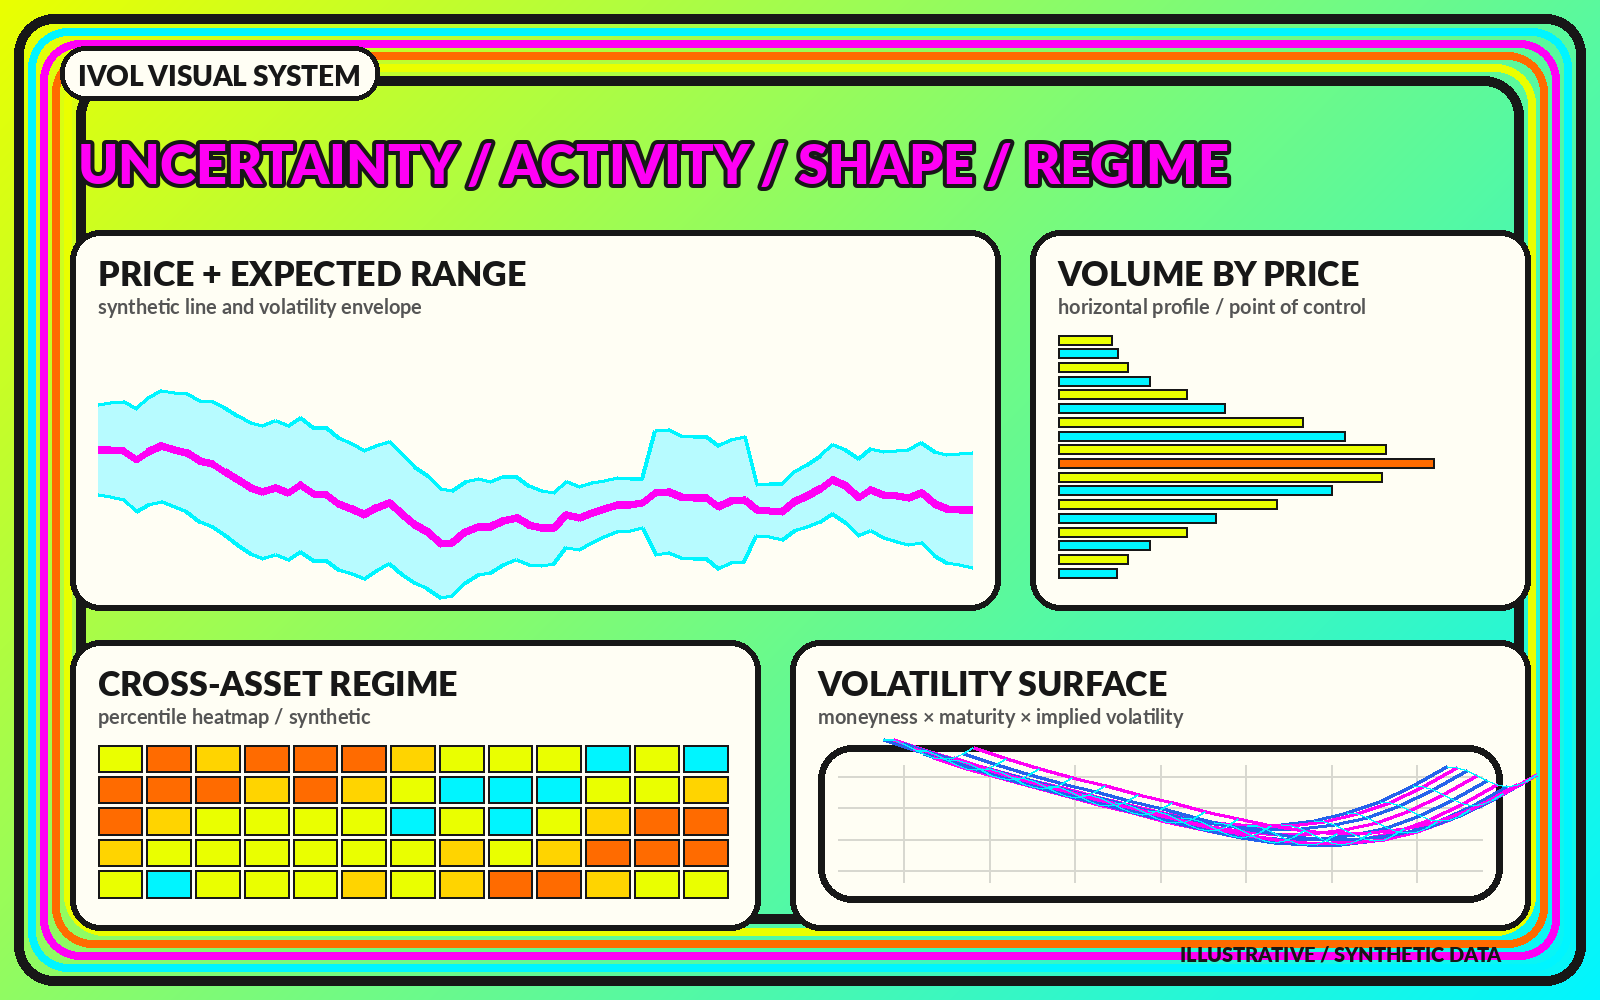
A visual map of how markets measure movement and price uncertainty—through time, across strikes, across expirations, and across regimes.
Volatility describes the size and dispersion of price changes over a defined horizon. It does not state whether an asset will rise or fall. A complete volatility label needs at least four parts: the asset, measurement method, observation or forecast horizon, and units. “30-day implied volatility for an equity index” is a different object from “20-day realized volatility for one stock,” even when both are displayed as annualized percentages.
ivol.xyz separates the volatility landscape into observed movement, option-implied uncertainty, distribution shape, and regime context. The visual system treats each as a related layer rather than blending them into a single fear score.
Implied volatility is inferred from option prices for a strike and expiration. It is forward-looking in horizon but not a guaranteed forecast. Realized volatility is calculated from returns that already occurred. It is backward-looking in sample, although it may be used as an input to forecasts. Comparisons require aligned dates and horizons.
A chart should display the two measures in separate, synchronized panels. That keeps a forward option-market measure from being mistaken for the historical path it is later compared against. It also makes window effects visible when a large return enters or exits a rolling realized-volatility calculation.
A common approximation translates an annualized volatility rate into a shorter-horizon move by multiplying price by volatility and the square root of time expressed as a fraction of a year. The result is an estimate under simplified assumptions, not a hard price boundary. Bands should state the horizon, annualization basis, volatility input, and whether the center is spot or forward price.
Range is not direction. A wider band means more movement is priced or observed; it does not say which edge the market will approach first.
A volatility number becomes more useful when its history, term structure, strike shape, and data lineage remain visible.
Best for level, persistence, spikes, rolling windows, and comparison with returns. Keep window and annualization visible.
Best for option-implied shape across strikes or expirations. Use stable moneyness conventions and fixed scales.
Best for two-dimensional structure across strike and time. Mark observed nodes and modeled or extrapolated regions.
No. Higher volatility means larger variation or more priced uncertainty. Whether that is harmful depends on exposure, time horizon, liquidity needs, and strategy.
Raw percentages preserve each market's scale but may not be comparable across assets with different baselines. Percentiles can support comparison when the lookback and method are stated.
Differences can arise from strike selection, interpolation, dividends, rates, session treatment, sampling, cleaning, and annualization. Methodology is part of the data.