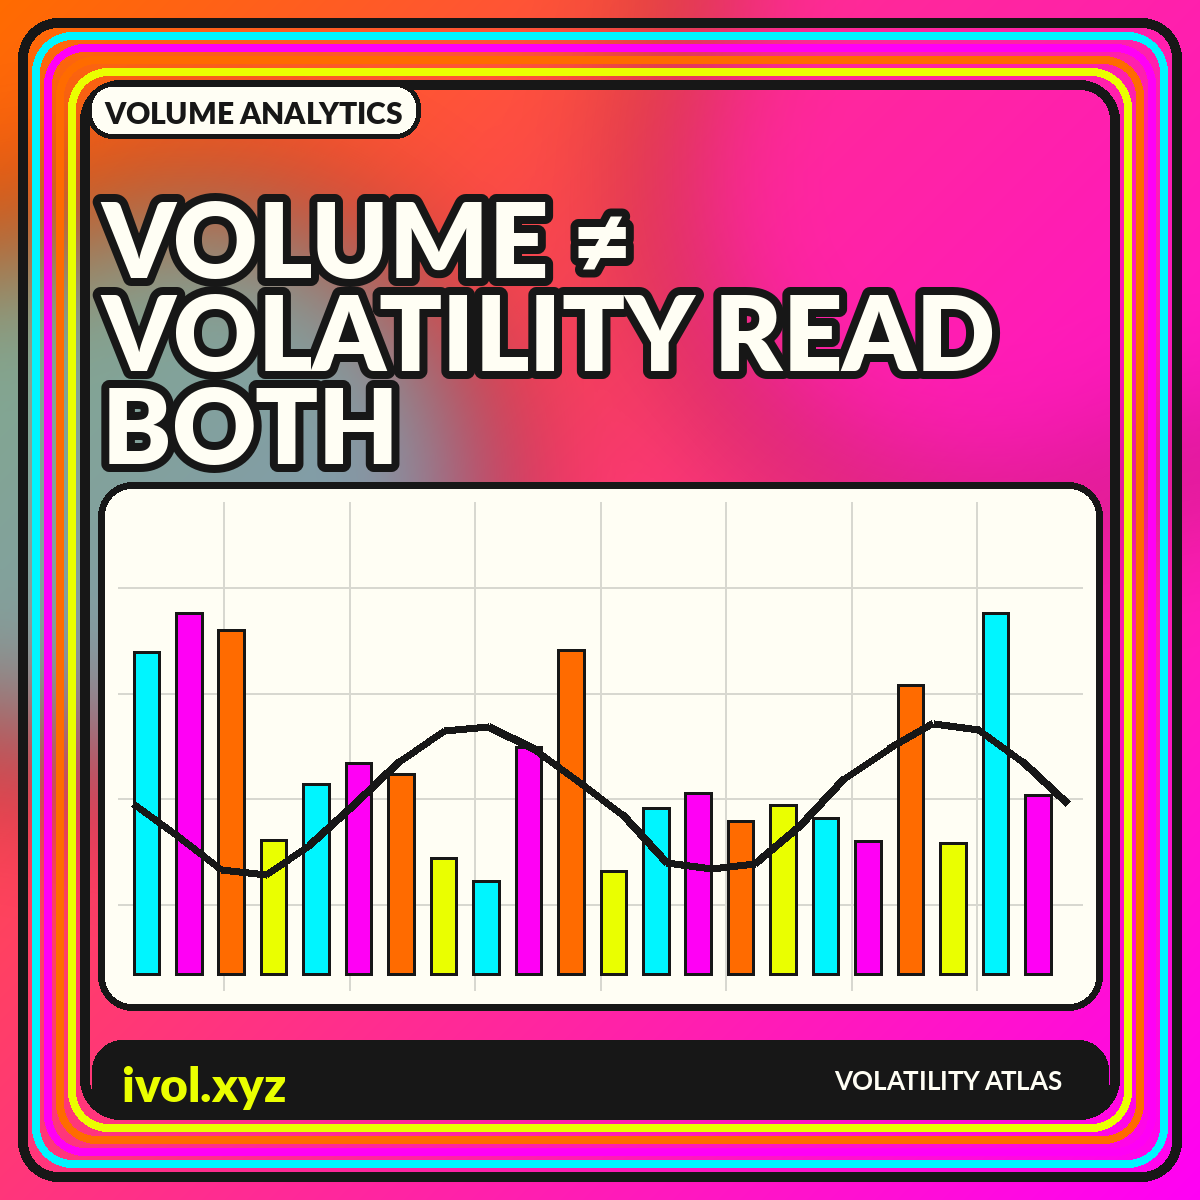
Trading volume and volatility are often placed side by side because both tend to attract attention during active markets. They do not measure the same thing. Volume counts how much trading occurred under a market's reporting convention. Volatility describes the size or dispersion of price changes, either observed from returns or implied by option prices. A session can have heavy volume and modest movement, or violent movement on relatively thin volume. The combination matters more than either series viewed in isolation.
A useful visualization separates four ideas that are frequently blended together: activity, liquidity, direction, and variability. Volume is primarily an activity measure. Bid-ask spreads and depth speak more directly to liquidity. Returns carry direction. Realized or implied volatility describes variability or priced uncertainty. This guide shows how to compare these dimensions, normalize them across assets and time, and avoid the visual shortcuts that turn correlation into an unsupported causal story.
What trading volume counts
Volume is the number of shares, contracts, units, or notional amount traded during a specified interval, depending on the market and dataset. The interval may be one minute, one session, or one month. The counting convention also matters: exchange-listed futures volume is reported by contract, while consolidated equity feeds and decentralized digital-asset venues can have different coverage. Before comparing charts, identify the unit, venue set, session boundaries, corrections policy, and whether block or off-exchange activity is included.
The CME Group lesson on trading volume notes that futures volume counts contracts traded and can be measured across daily or intraday intervals. It also emphasizes a crucial limitation: raw volume does not by itself reveal whether a trade opened or closed a position, or whether the initiating motive was bullish or bearish. Every completed trade has a buyer and a seller. Labels such as “buy volume” and “sell volume” require an additional classification method based on quotes, tick direction, or exchange-provided aggressor data.
What volatility measures
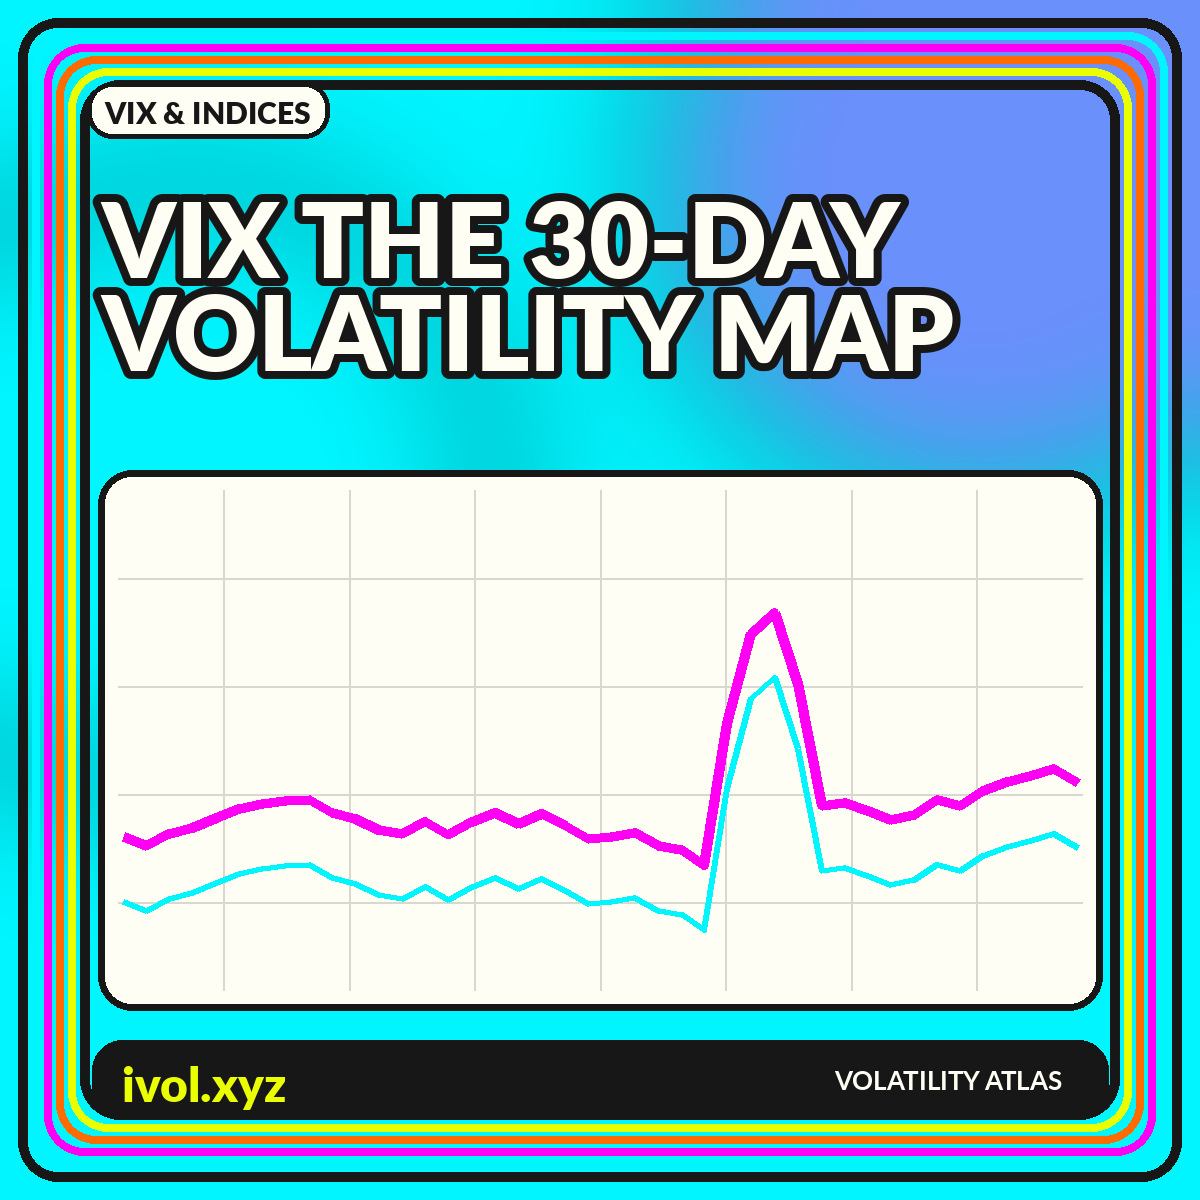
Realized volatility summarizes the variation in observed returns over a chosen window and sampling frequency. Implied volatility is inferred from option prices for a forward-looking horizon. Intraday range measures use highs and lows, while close-to-close estimators use a narrower information set. These methods can disagree because they answer different questions. A five-minute realized-volatility series is not interchangeable with a 30-day option-implied measure, even if both are displayed as annualized percentages.
Volatility is not a count of trades and not a direct liquidity statistic. A price can jump through a sparse order book after only a few transactions, producing high volatility with low volume. Conversely, a liquid market can absorb a large quantity near one price, producing high volume with low short-horizon volatility. This is why a dashboard should not use volume as a substitute when volatility data are missing, or interpret a quiet price as proof that participation was low.
Why volume and volatility often rise together
News, rebalancing, forced deleveraging, and disagreement can generate both more trading and larger price changes. As new information arrives, participants revise valuations, hedgers adjust exposures, market makers update quotes, and stop orders may activate. The result can be a positive relationship between absolute returns and volume. That relationship is a recurring empirical pattern, but its strength varies by asset, market structure, time scale, and event type. It should be measured rather than assumed.
A scatter plot of normalized volume against absolute return makes the relationship visible without relying on two time-series axes. Add density contours or hexagonal bins when there are many observations, and color points by market regime or session. A fitted line can summarize association, but show a robust statistic such as Spearman correlation alongside it. Extreme days can dominate ordinary least-squares results, and both series often have skewed distributions that violate simple linear assumptions.
High volume with low volatility
Heavy trading can occur around index rebalances, contract rolls, option expirations, closing auctions, and large portfolio transfers without producing a large directional move. Buyers and sellers may meet at a well-established price while substantial inventory changes hands. In these cases, high volume confirms activity, not instability. A volume bar that towers over its neighbors can therefore coexist with a narrow candle and a low realized-volatility reading.
To understand the episode, pair volume with range, spread, order-book depth, and the location of trades within the session. A closing-auction spike should not be compared uncritically with continuous trading. For futures, volume migrating from an expiring contract to the next contract can reflect roll mechanics rather than a new market view. Use a calendar of structural events and segment session types so mechanical activity does not contaminate an event study.
High volatility with low volume
Thin markets can move sharply because relatively small orders encounter limited resting liquidity. Overnight sessions, holiday periods, newly listed assets, and stressed venues can all produce large price gaps without record activity. A low-volume price move is sometimes dismissed as meaningless, but it may reveal an important lack of depth. The correct conclusion is not automatically that the move will reverse; it is that the market reached the new price with limited observed participation.
Show gaps and session boundaries explicitly. A line chart that connects the prior close to the next trade can make an overnight repricing look like continuous volatility. Candles, event markers, and a separate panel for quote depth or spread make the liquidity context clearer. For cross-venue assets, confirm whether volume coverage is comprehensive: a move may appear low-volume only because the selected dataset omits the venue where most activity occurred.
Normalize before comparing assets
Raw volume is rarely comparable across instruments. One contract may represent a large notional exposure, while another represents a small unit. Share volume also rises mechanically after stock splits and can trend with market capitalization, participation, or venue fragmentation. Common normalizations include volume divided by a rolling average, dollar volume, turnover relative to shares outstanding, or contract volume multiplied by contract size and price. Each transform answers a different question and should be labeled.
Volatility needs consistent normalization too. Compare return volatility over the same sampling window and annualization convention. If one asset trades around the clock and another has a defined cash session, decide whether overnight returns are included. For a cross-asset chart, index each series to its own percentile or z-score and retain a table of raw units. Normalized values support comparison, while raw values preserve economic meaning.
Volume, open interest, and turnover are not synonyms
In derivatives, open interest counts outstanding contracts, while volume counts transactions during an interval. Volume can be high with unchanged open interest if positions are transferred or closed and opened in offsetting ways. In equities, turnover often refers to trading relative to shares outstanding or free float. In portfolio analytics, turnover can instead describe how much a strategy traded. A chart labeled simply “activity” can hide these distinctions and lead readers to compare incompatible series.
Use separate labels and avoid stacking unlike quantities in one bar. For a futures contract, a three-panel view of price, volume, and open interest can reveal whether participation is expanding or merely rotating. During a contract roll, aggregate volume and open interest across adjacent maturities or show them separately with clear rollover markers. A continuous price series paired with only the front contract's raw volume can create misleading discontinuities.
Building a volume-volatility dashboard
Start with a price panel, then place normalized volume and realized volatility in aligned panels below it. Add a scatter view for the relationship and a calendar heatmap for recurring time-of-day or day-of-week patterns. Tooltips should display raw and normalized values, the session definition, and any data-quality flag. When the dataset is illustrative, watermark the chart and state that values are synthetic; when it is live, show the timestamp and delay status.
Choose chart intervals based on the decision horizon. Minute bars can expose liquidity shocks but are noisy and sensitive to trade classification. Daily bars suit regime analysis but conceal intraday concentration. Avoid a single correlation number for the entire history; use rolling estimates and event windows. Most importantly, do not turn high volume into a directional arrow. Activity tells you that the market traded. Price, order flow, and volatility reveal how that activity was expressed.
Conclusion
Volume and volatility are complementary, not interchangeable. Volume measures observed trading activity under a specific reporting convention. Volatility measures the dispersion of price changes or the uncertainty embedded in option prices. They often rise together around information shocks, yet meaningful divergences occur during auctions, rolls, thin sessions, and liquidity gaps.
The best charts preserve those distinctions. Normalize units, label sessions, pair activity with liquidity measures, and compare like horizons. Use scatter plots and rolling relationships instead of forcing two lines onto a dramatic dual axis. When volume and volatility disagree, treat the divergence as a question to investigate—not as an automatic trading signal.