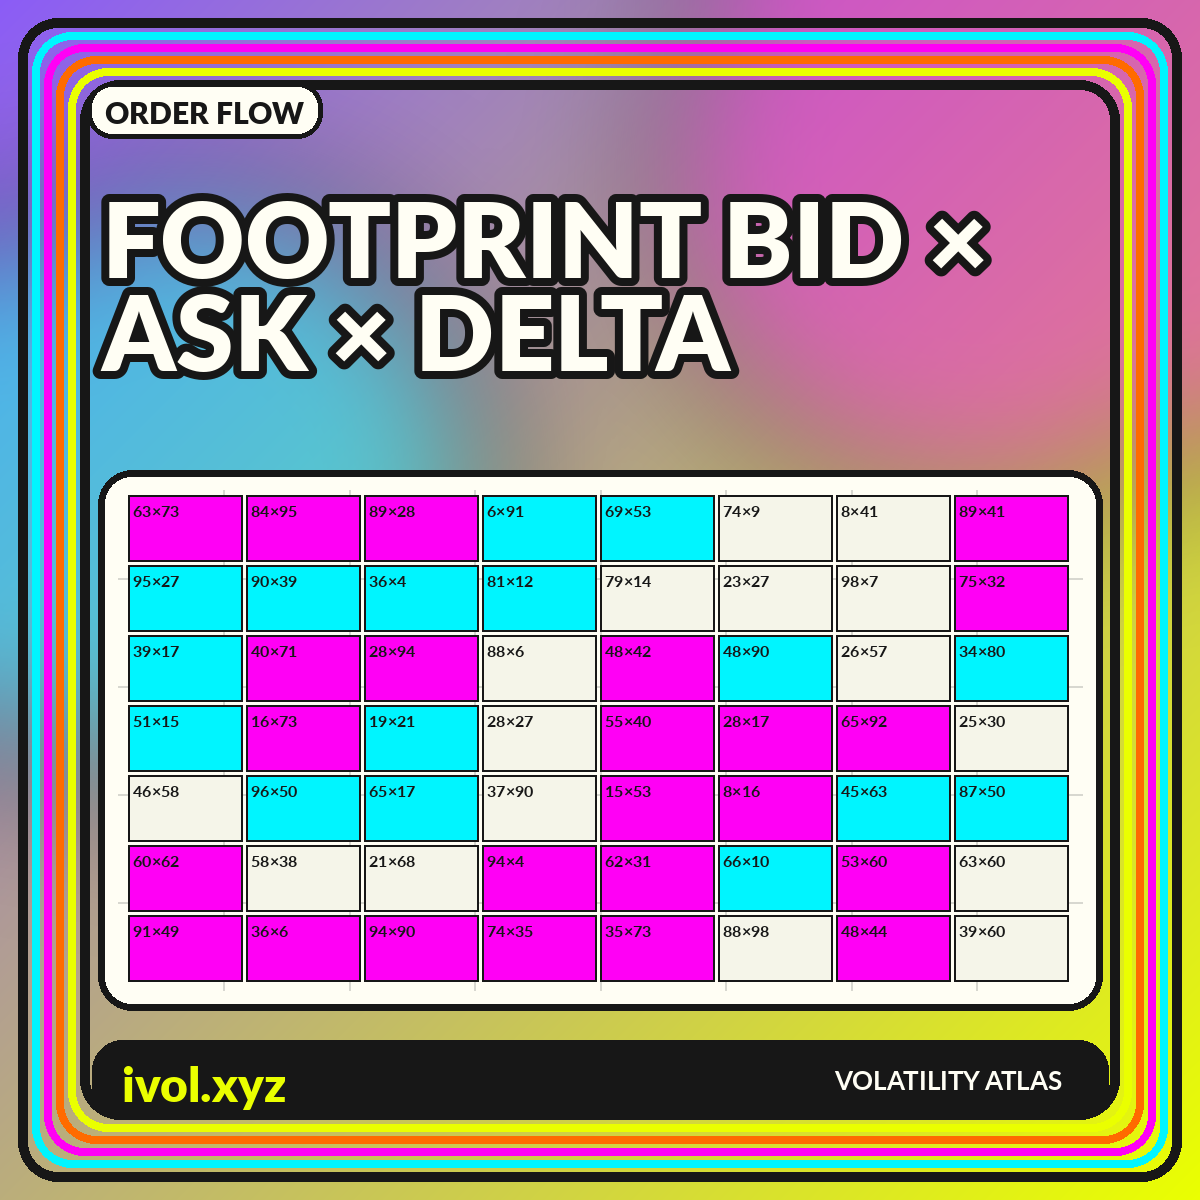
Order Flow
Volumetric Footprint Charts: Bid, Ask, Delta, and Imbalance Explained
Footprint charts place volume inside each price bar. Learn what bid/ask cells, delta, and imbalance show—and what they cannot prove about market intent.
Activity measured through time, price, venue, and contract.
Footprint charts place volume inside each price bar. Learn what bid/ask cells, delta, and imbalance show—and what they cannot prove about market intent.
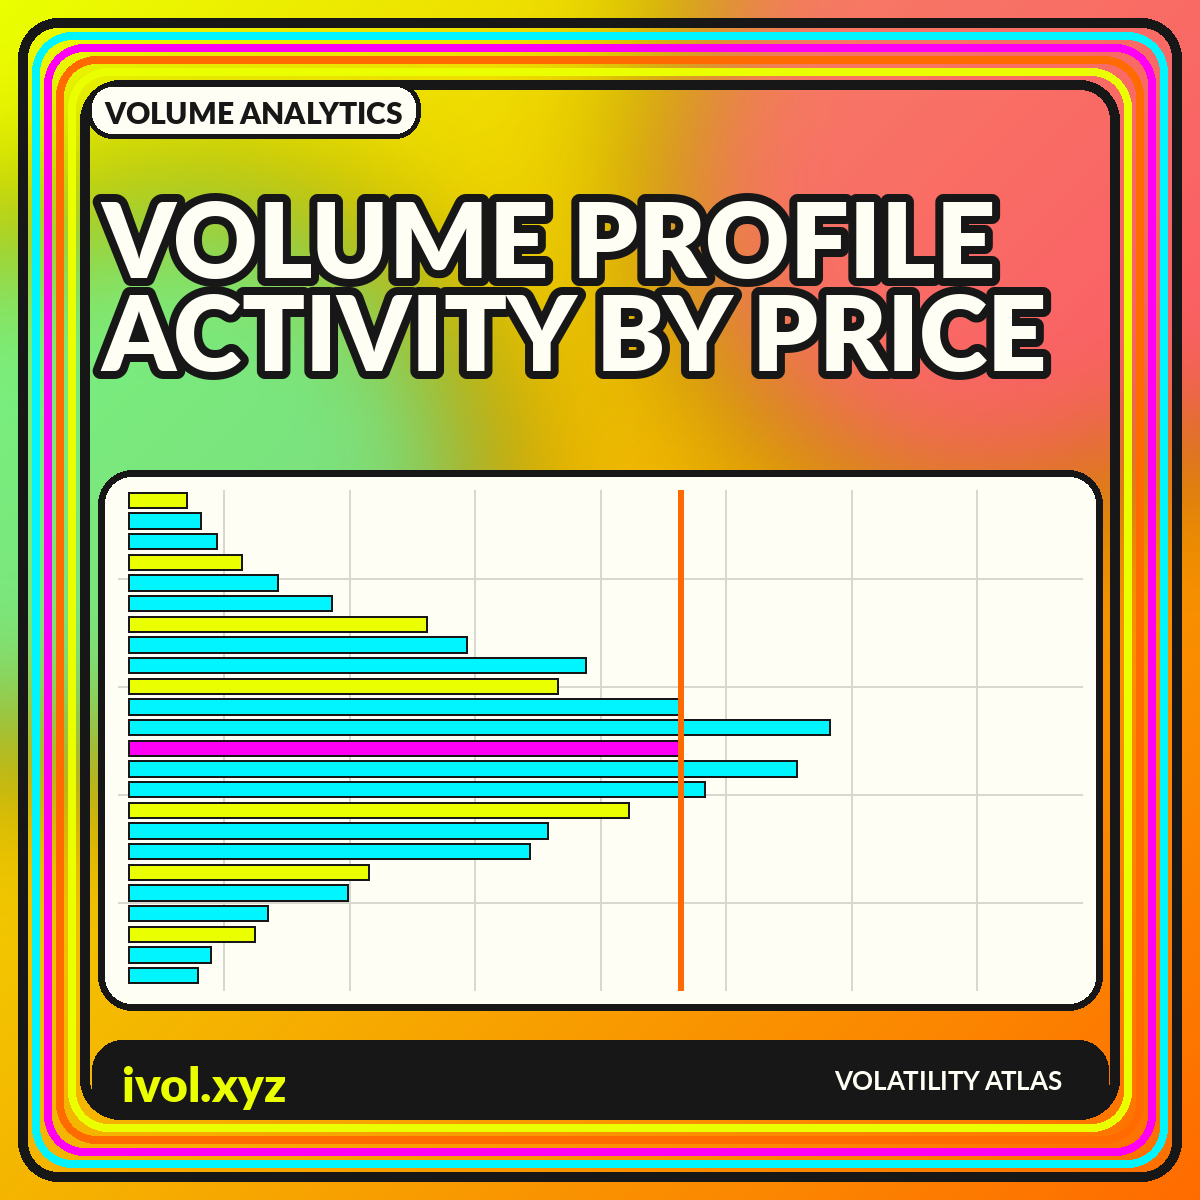
Volume profile rotates the usual histogram: instead of volume by time, it maps activity by price. Here is how to read the shape and its limits.
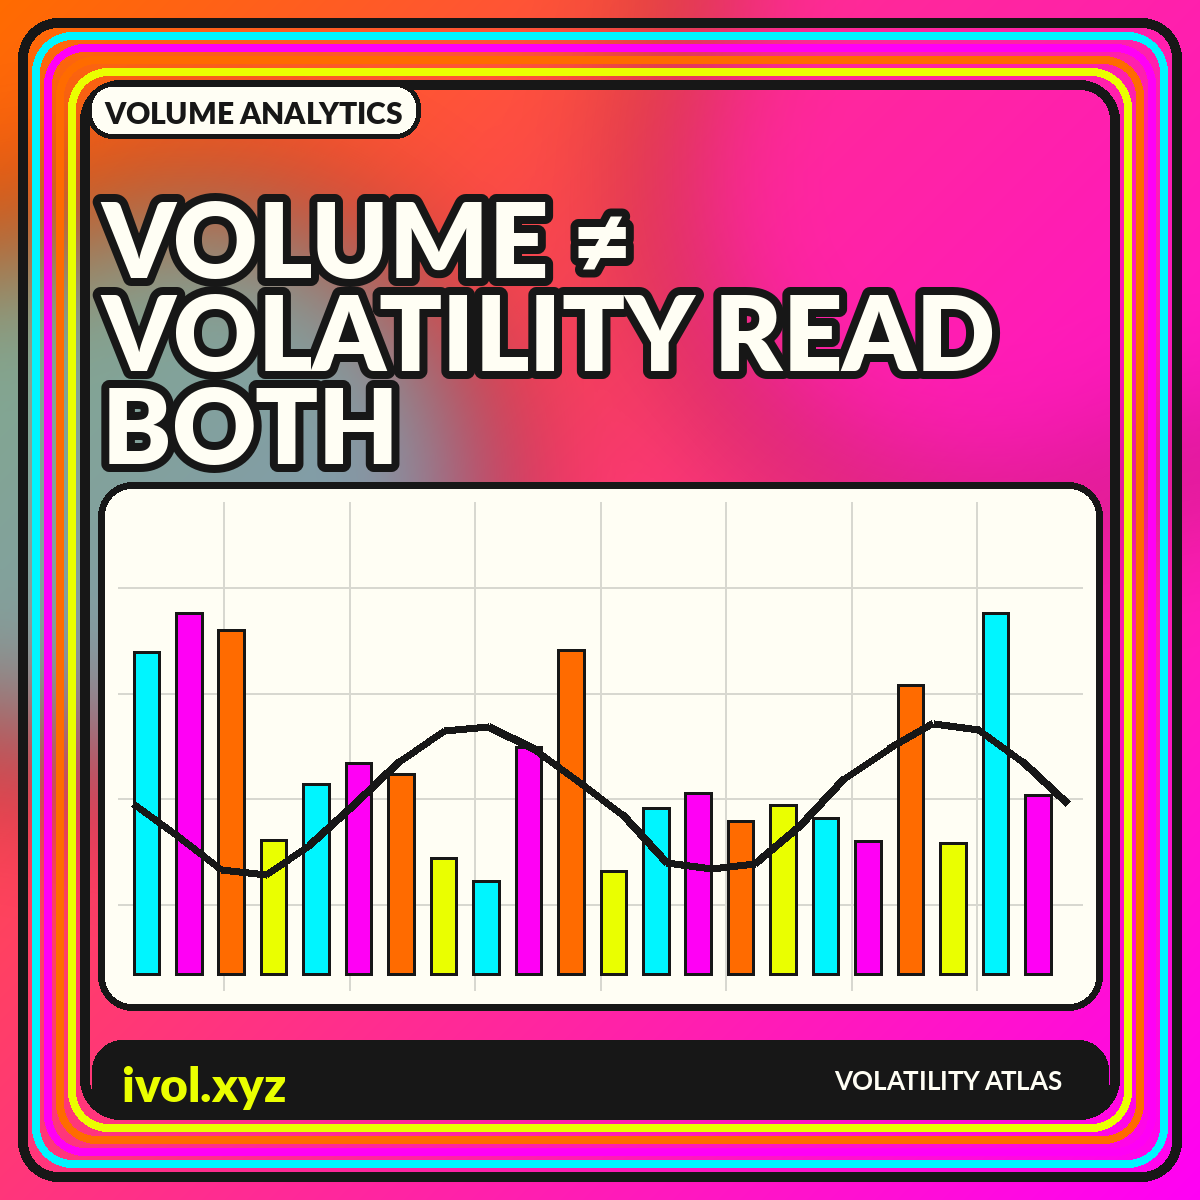
Volume counts activity; volatility describes price variation. Learn when they move together, when they diverge, and how to chart both without confusing causation.