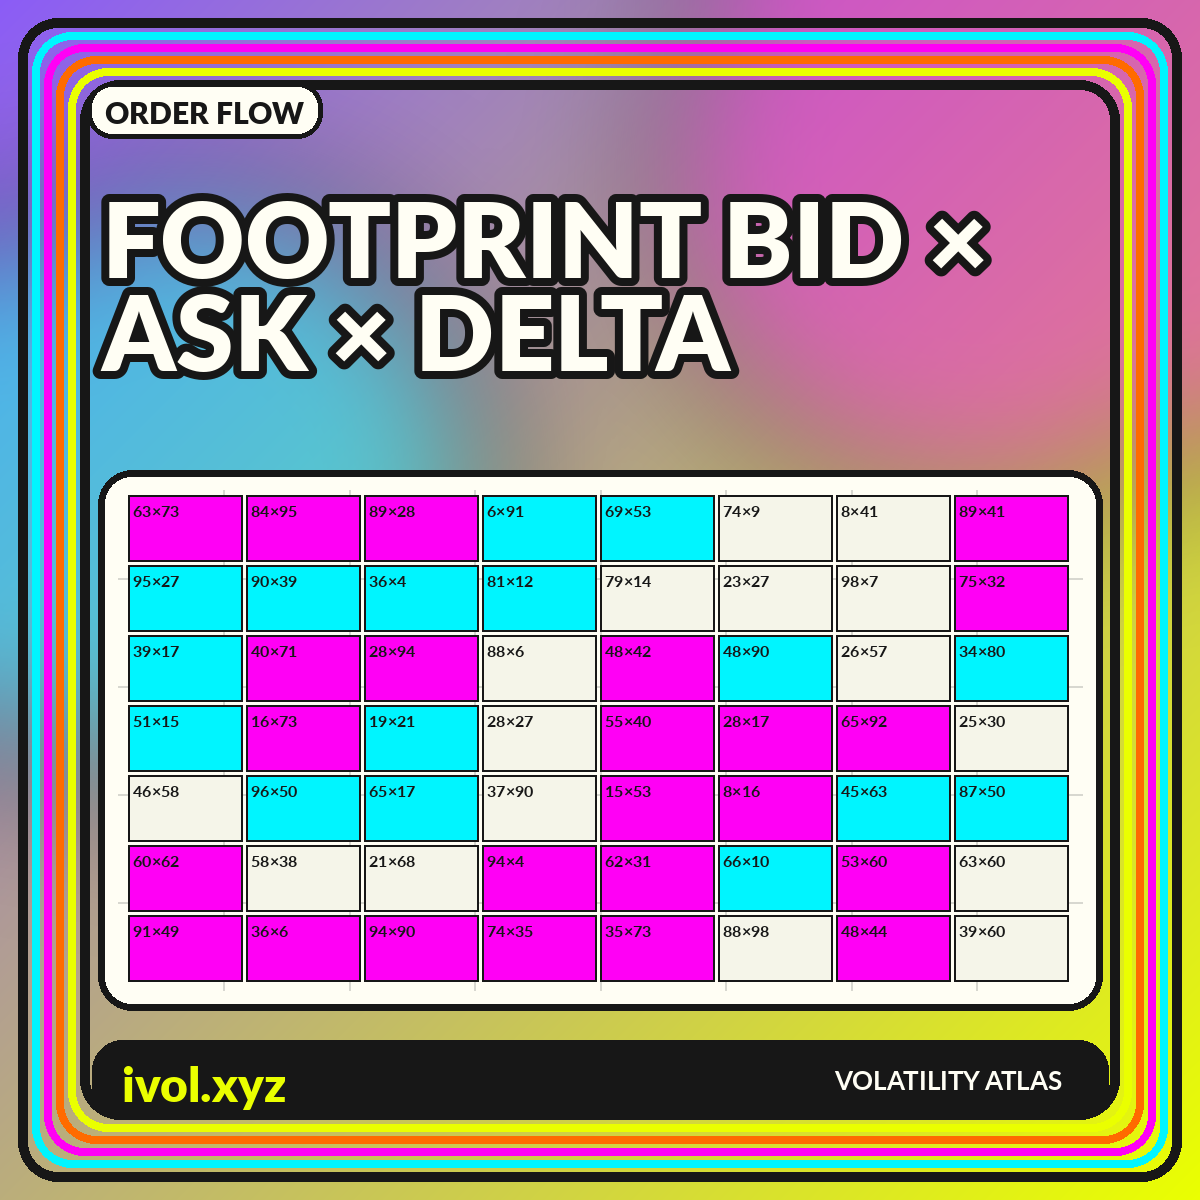
A volumetric footprint chart opens the interior of a price bar. Instead of showing only open, high, low, and close, it distributes traded volume across price levels and often separates transactions classified at the bid from those classified at the ask. The cells can display total volume, bid/ask pairs, delta, imbalance, or other statistics. This additional detail can reveal where trading concentrated, but it also introduces more assumptions, more data demands, and more opportunities for false precision.
Footprint charts are commonly described as order-flow tools, yet they show executed trades rather than every intention resting in the order book. They cannot identify the motive of a participant, and their buy/sell labels depend on trade-classification rules. The most useful reading combines the footprint with price response, liquidity, time, and market context. This guide explains the visual grammar and a reproducible workflow for interpreting it without turning colored cells into a deterministic story.
What a footprint cell represents
Each candle covers a time interval or another bar-building rule. Inside it, the platform groups executions into price rows. A bid/ask footprint typically shows volume classified as trading at or near the bid on one side and volume classified as trading at or near the ask on the other. Total footprint views combine the two. Delta subtracts one side from the other under the platform's convention, so positive delta usually indicates more ask-classified volume and negative delta more bid-classified volume.
The TradingView guide to volume footprint charts documents common footprint elements including buy and sell volume, delta, imbalances, value areas, and points of control. A chart user should still verify the exact platform definition. Some feeds provide aggressor-side flags directly; others infer side from quotes or tick rules. During fast markets, quote changes, bundled trades, and reporting latency can affect classification. The cell is a processed data product, not a direct camera view of buyer and seller intention.
Bid volume, ask volume, and aggressor labels
A market order or marketable limit order generally consumes resting liquidity. When an execution occurs against the displayed ask, platforms often label it buyer-initiated; against the bid, seller-initiated. This describes which side crossed the spread, not who is smart, informed, opening, closing, or ultimately profitable. A passive seller can absorb aggressive buying, and an aggressive buyer may be hedging a short position rather than expressing a bullish view.
Use neutral language such as ask-classified and bid-classified volume when methodology is uncertain. Avoid captions that say “buyers entered here” merely because the right-hand number is larger. Every execution includes both a buyer and a seller. What changes is the role each side played relative to the current quotes. A strong reading therefore asks how price responded to the imbalance: did it continue, stall, reverse, or move only after liquidity shifted elsewhere?
Delta and cumulative delta
Bar delta summarizes the difference between ask-classified and bid-classified volume within one bar. Cumulative delta adds those differences through a session or chosen period. Traders compare delta with price to look for confirmation or divergence. Rising price with positive delta is intuitive, while rising price with negative delta may suggest passive buying, classification effects, or a mismatch between the selected venue and the broader market. The pattern is a prompt for investigation, not a self-contained conclusion.
Cumulative delta is highly sensitive to the reset point, feed coverage, and opening value. Resetting each session answers a different question from carrying the total across weeks. A single large event can dominate the scale and make later changes look flat. Plot the series in its own panel, mark resets, and allow readers to inspect bar-level values. When comparing assets, normalize delta by total volume because raw contract or share counts are not comparable.
Diagonal imbalance and stacked imbalance
Many footprint platforms compare ask volume at one price with bid volume one tick lower, reflecting the diagonal relationship across the spread. If the ratio exceeds a threshold and minimum-volume rule, the cell is highlighted as an imbalance. Several adjacent highlighted levels form a stacked imbalance. Settings vary widely: a 300% ratio with a minimum of 10 contracts can produce a very different chart from a 200% ratio with no filter.
Imbalance highlighting is a conditional formatting rule, not a discovery of hidden demand. Thin rows can create enormous percentages from tiny denominators, while thick markets may require much larger absolute differences to matter. Display both the ratio and the underlying volumes, apply a sensible minimum, and test nearby thresholds. If an apparent signal disappears when the ratio moves from 300% to 275%, it may be more a formatting artifact than a robust feature.
Absorption, exhaustion, and unfinished auctions
Footprint commentary often uses terms such as absorption, exhaustion, and unfinished auction. Absorption generally describes aggressive volume meeting enough passive liquidity that price does not continue as expected. Exhaustion describes fading participation near an extreme. An unfinished auction may refer to both sides recording volume at a bar's high or low rather than a cleaner one-sided ending. These are interpretive labels, not directly measured variables, and platforms may define them differently.
To evaluate absorption, compare unusually large aggressive volume with limited price progress and subsequent behavior. Include order-book changes when available, because executed volume alone cannot show all canceled or replenished liquidity. At an extreme, low volume can indicate exhaustion, but it can also reflect a fast gap through sparse prices. Sequence matters: a static screenshot may hide whether the level held immediately, broke later, or was revisited after conditions changed.
Resolution, aggregation, and tick size
The vertical resolution determines how trades are grouped. Native tick size preserves detail but can make a chart unreadable in a high-priced or very active instrument. Combining several ticks per row reduces noise and reveals broader concentrations, but it can merge distinct levels. Time resolution matters too: a five-minute footprint and a range-bar footprint can contain the same trades in different structures, changing where the reader perceives initiative and response.
Choose resolution according to liquidity and the decision horizon, then keep it stable during comparison. Published screenshots should state the bar type, interval, ticks per row, session, and imbalance settings. Avoid zoom-dependent aggregation unless the export records the final scale. A footprint that recalculates as the user zooms can create visually different evidence from the same data, which makes retrospective analysis difficult to reproduce.
Market data coverage and quality
Footprint charts require granular trade data and, for reliable side classification, high-quality quotes or exchange flags. Delayed feeds, aggregated bars, missing trades, and venue fragmentation can materially alter cells. Equity data from one exchange cannot describe the whole consolidated market. Crypto footprints from one venue may diverge from another. Futures contract rolls can split activity between maturities. The chart should identify the source and whether historical tick data are complete.
Data cleaning can also remove or redistribute prints. Corrections, out-of-sequence trades, block transactions, and exchange-specific reporting rules should be handled consistently. If the platform backfills only a limited history at tick resolution, older bars may be reconstructed from coarser data and become incomparable with recent bars. A metadata panel is not decorative; it is essential to deciding how much confidence the visual detail deserves.
A disciplined footprint workflow
Begin with higher-level context: trend, volatility regime, nearby event risk, and the session's range. Use the footprint to inspect a specific question, such as why price stalled at a prior high or how a breakout traded. Note total volume, delta, concentration, and price response. Compare the observation with adjacent bars rather than treating one colored cell as exceptional in isolation. Save settings with the screenshot so the result can be reviewed later.
For evaluation, define patterns before looking at outcomes. Record the threshold, location, entry condition, invalidation, and holding horizon. Include transaction costs and avoid using final bar data before the bar closes. Footprints are especially vulnerable to hindsight because dense cells make it easy to narrate any outcome. A repeatable rule and an out-of-sample test are more valuable than a beautifully annotated example chosen after the fact.
Conclusion
Volumetric footprint charts add a price-by-price layer to ordinary bars. Bid/ask classifications, delta, and imbalance can help describe how executions were distributed, but they do not reveal participant identity or intent. Their meaning depends on classification logic, tick resolution, session rules, venue coverage, and the price response that followed.
Treat the footprint as a microscope, not a compass. Start with a market question, inspect the relevant sequence, preserve settings, and validate patterns beyond selected screenshots. When the data lineage is clear and the interpretation remains modest, footprints can make trading activity more legible without pretending that every cell contains a forecast.