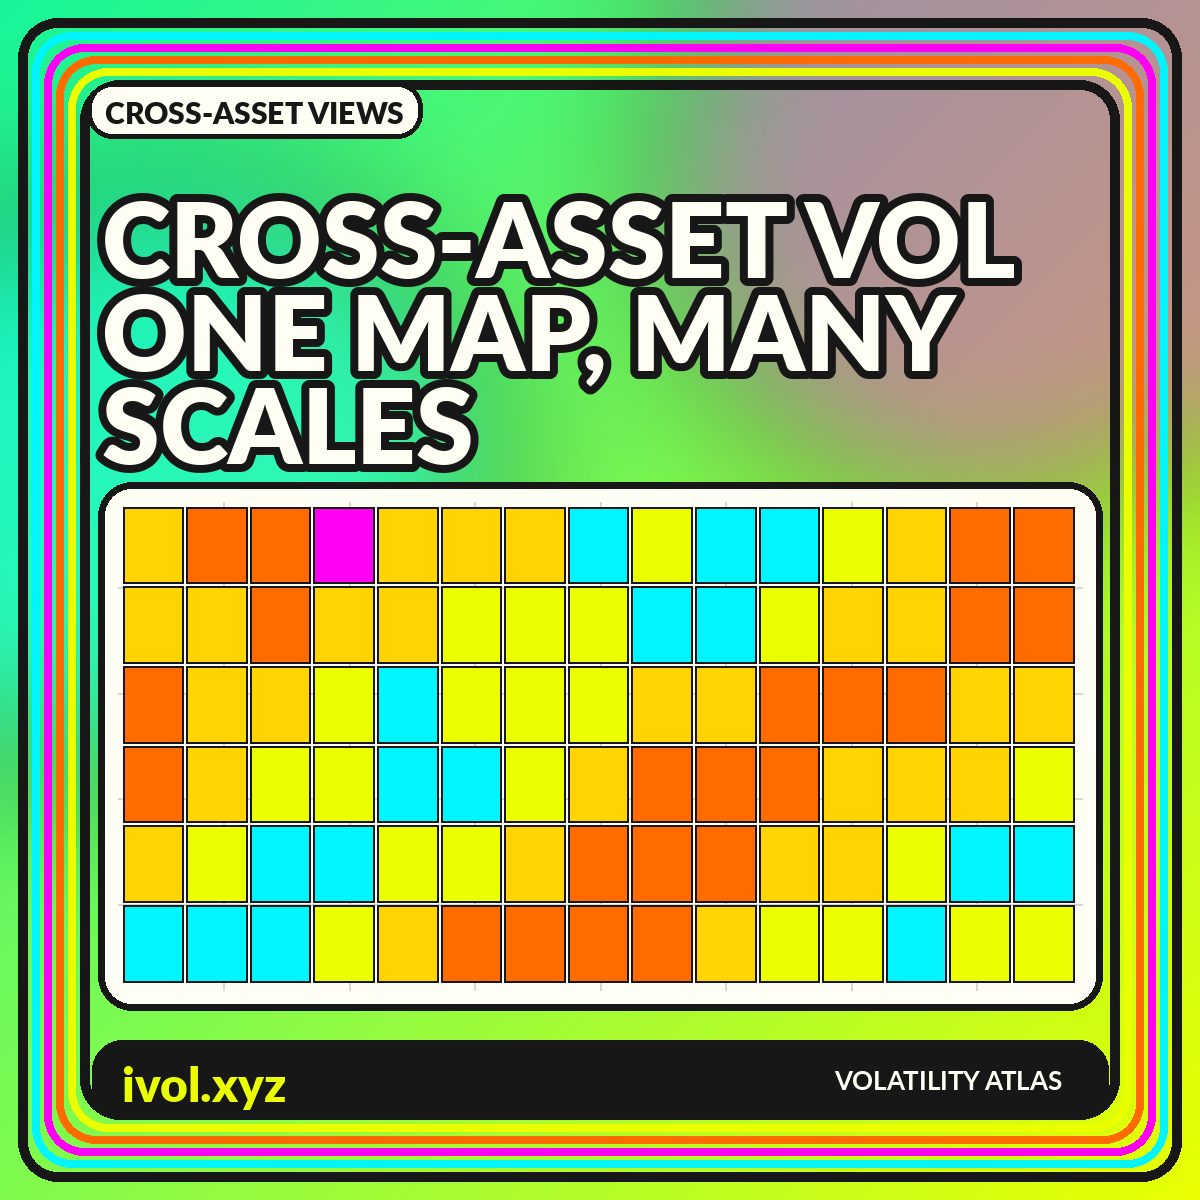
Cross-Asset Volatility Visualizations: Comparing Equities, Rates, FX, and Commodities
Cross-asset volatility charts can reveal shared stress and local shocks, but only after units, horizons, calendars, and index methodologies are aligned.
Chart design, normalization, metadata, and interpretation for volatility data.

Cross-asset volatility charts can reveal shared stress and local shocks, but only after units, horizons, calendars, and index methodologies are aligned.

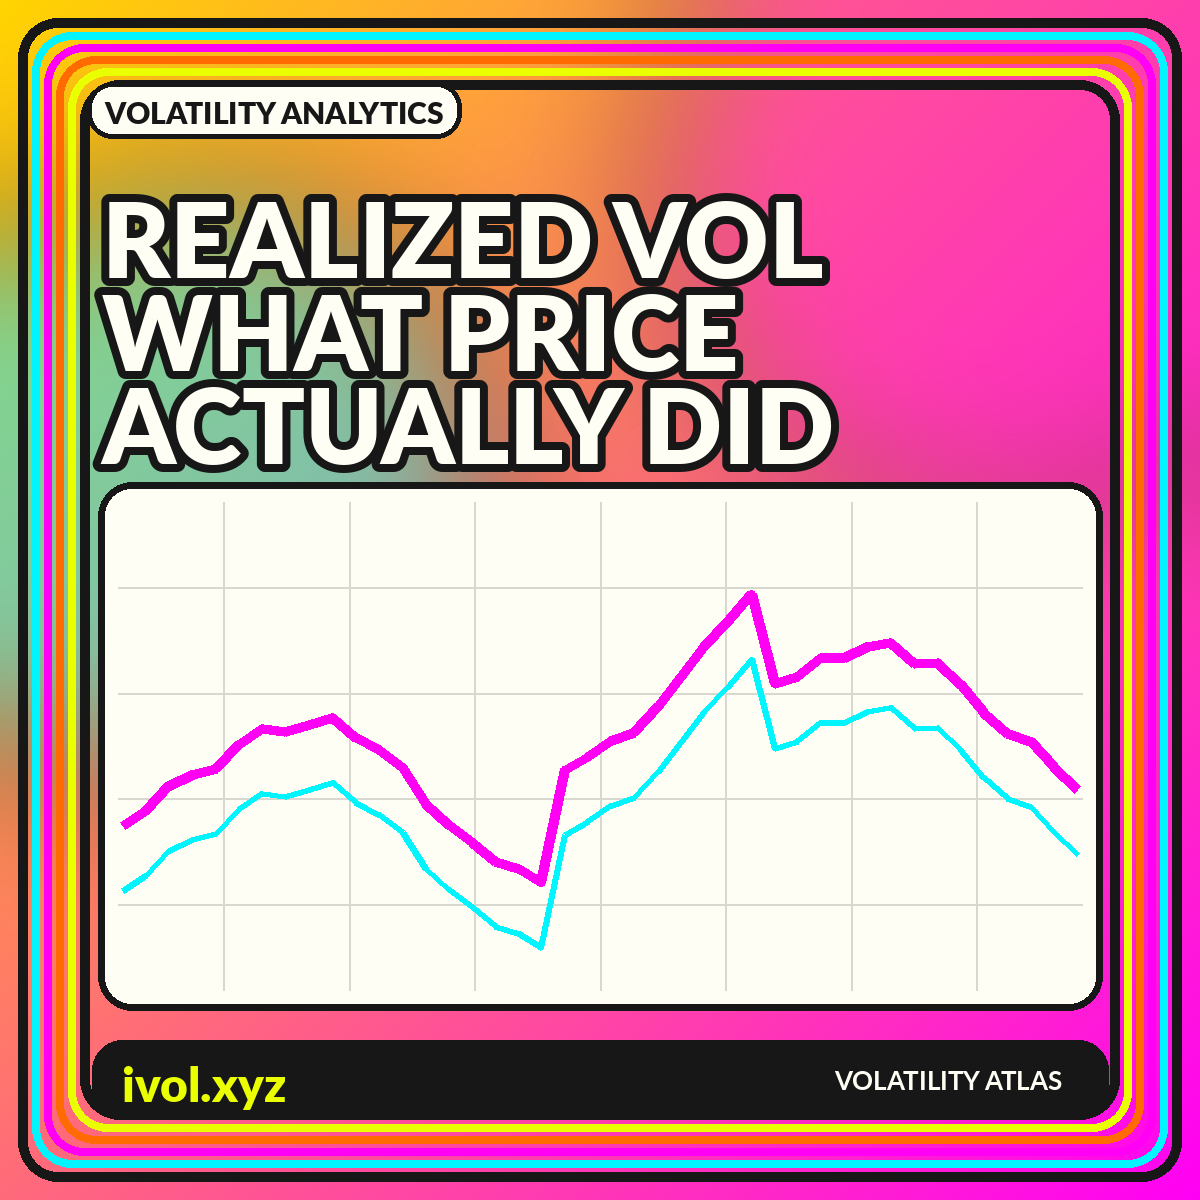
Large moves tend to arrive in groups. Explore rolling volatility, autocorrelation, regime bands, transitions, and the uncertainty behind every state label.

Realized volatility summarizes observed return variation, but the chart depends on window, sampling, estimator, session, and annualization choices.

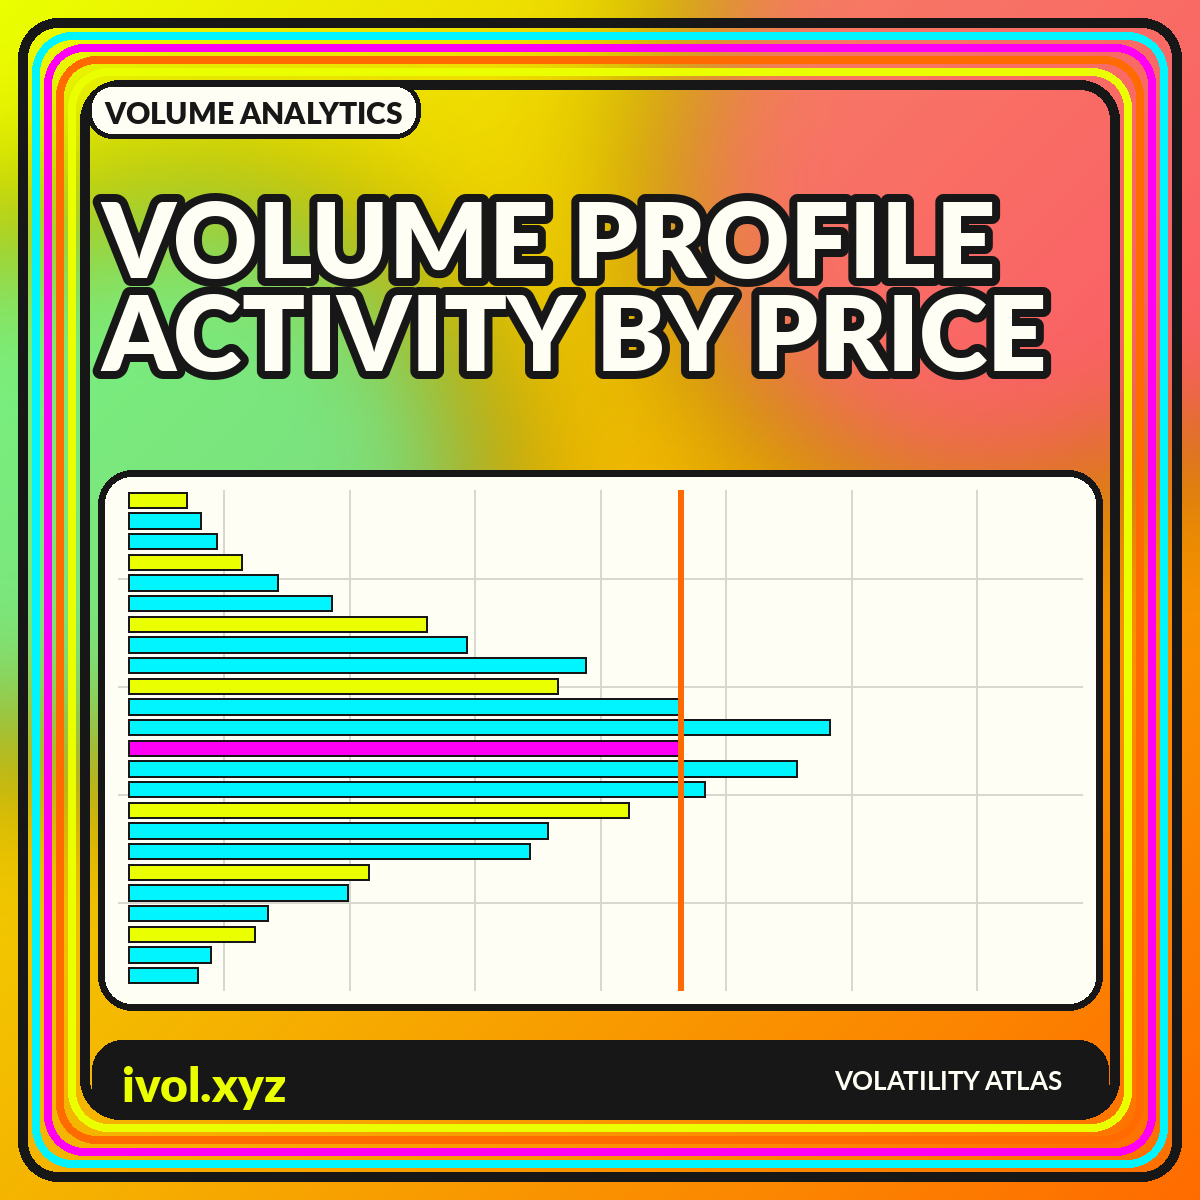
Volume profile rotates the usual histogram: instead of volume by time, it maps activity by price. Here is how to read the shape and its limits.

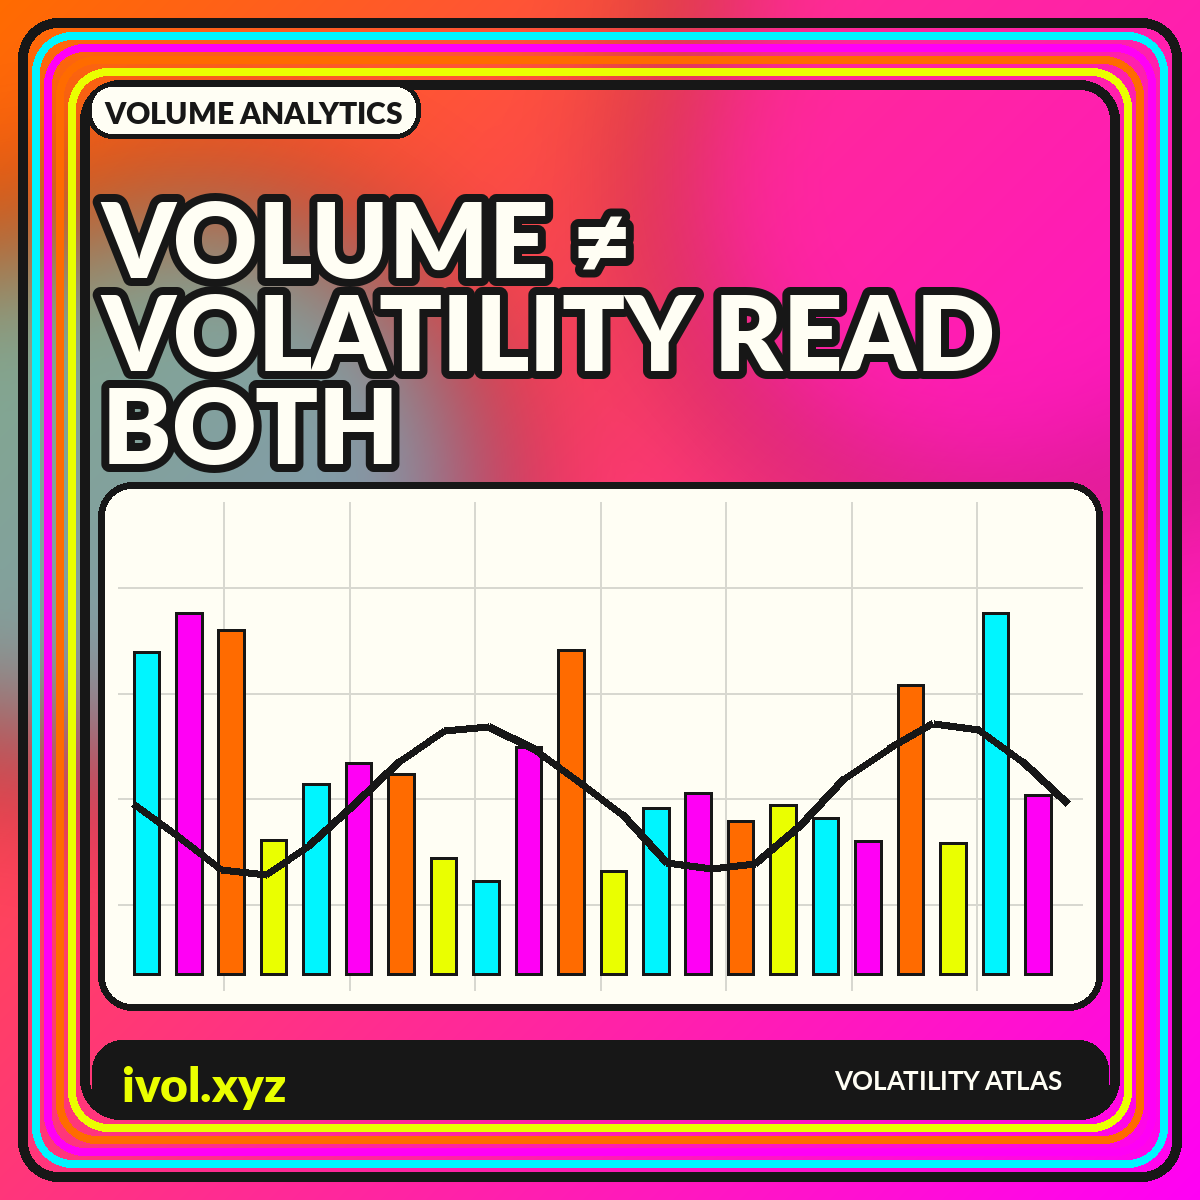
Volume counts activity; volatility describes price variation. Learn when they move together, when they diverge, and how to chart both without confusing causation.

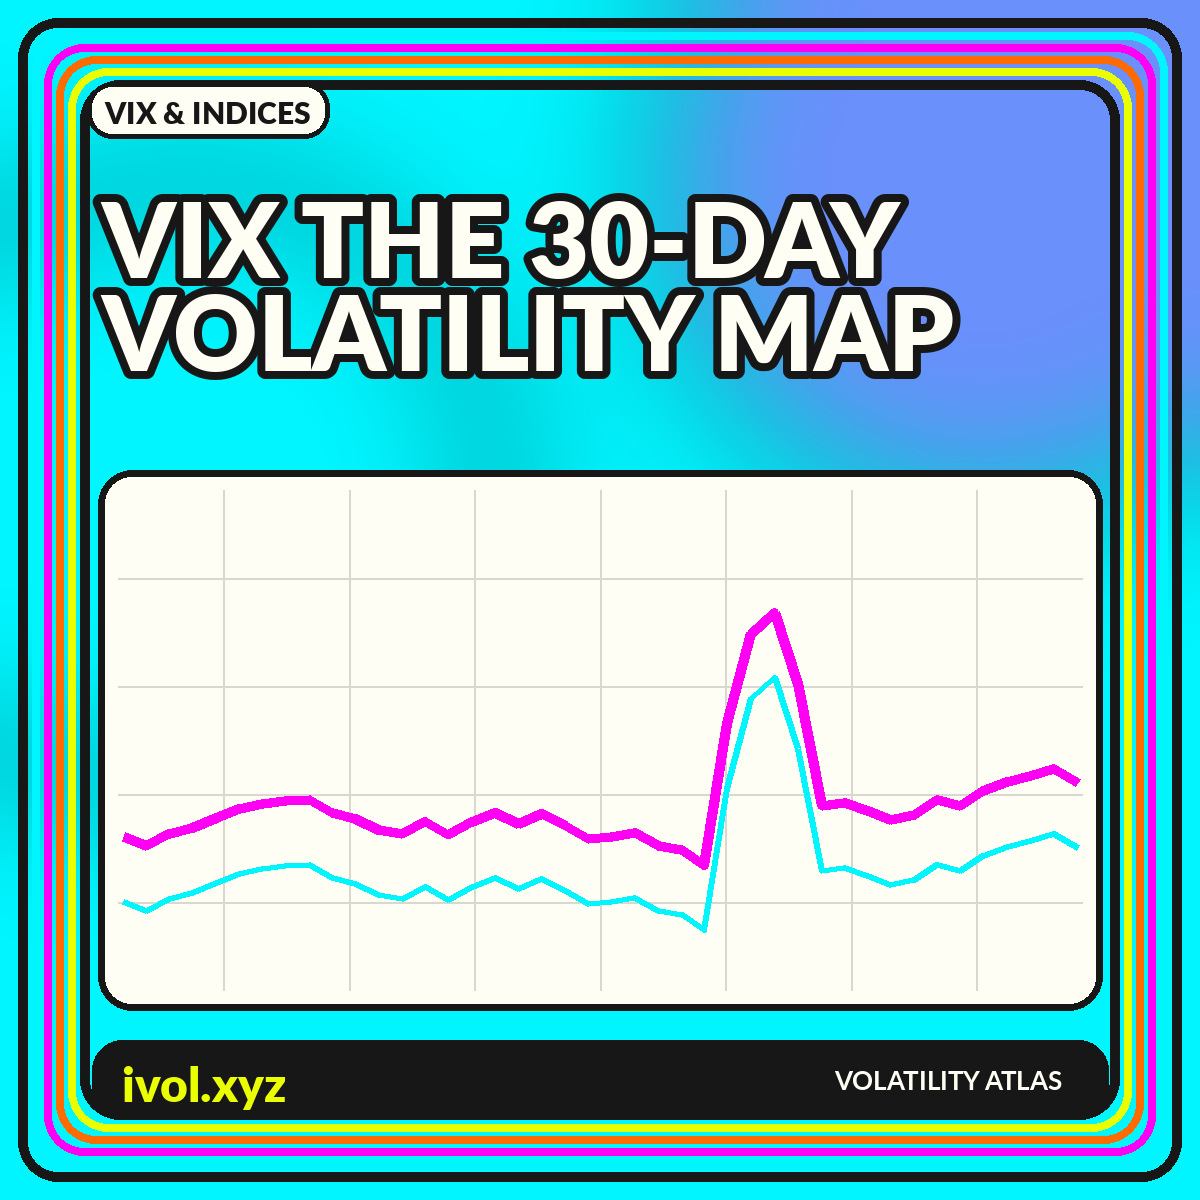
A visual guide to the VIX: its SPX option inputs, constant 30-day horizon, term structure, chart patterns, and interpretation limits.

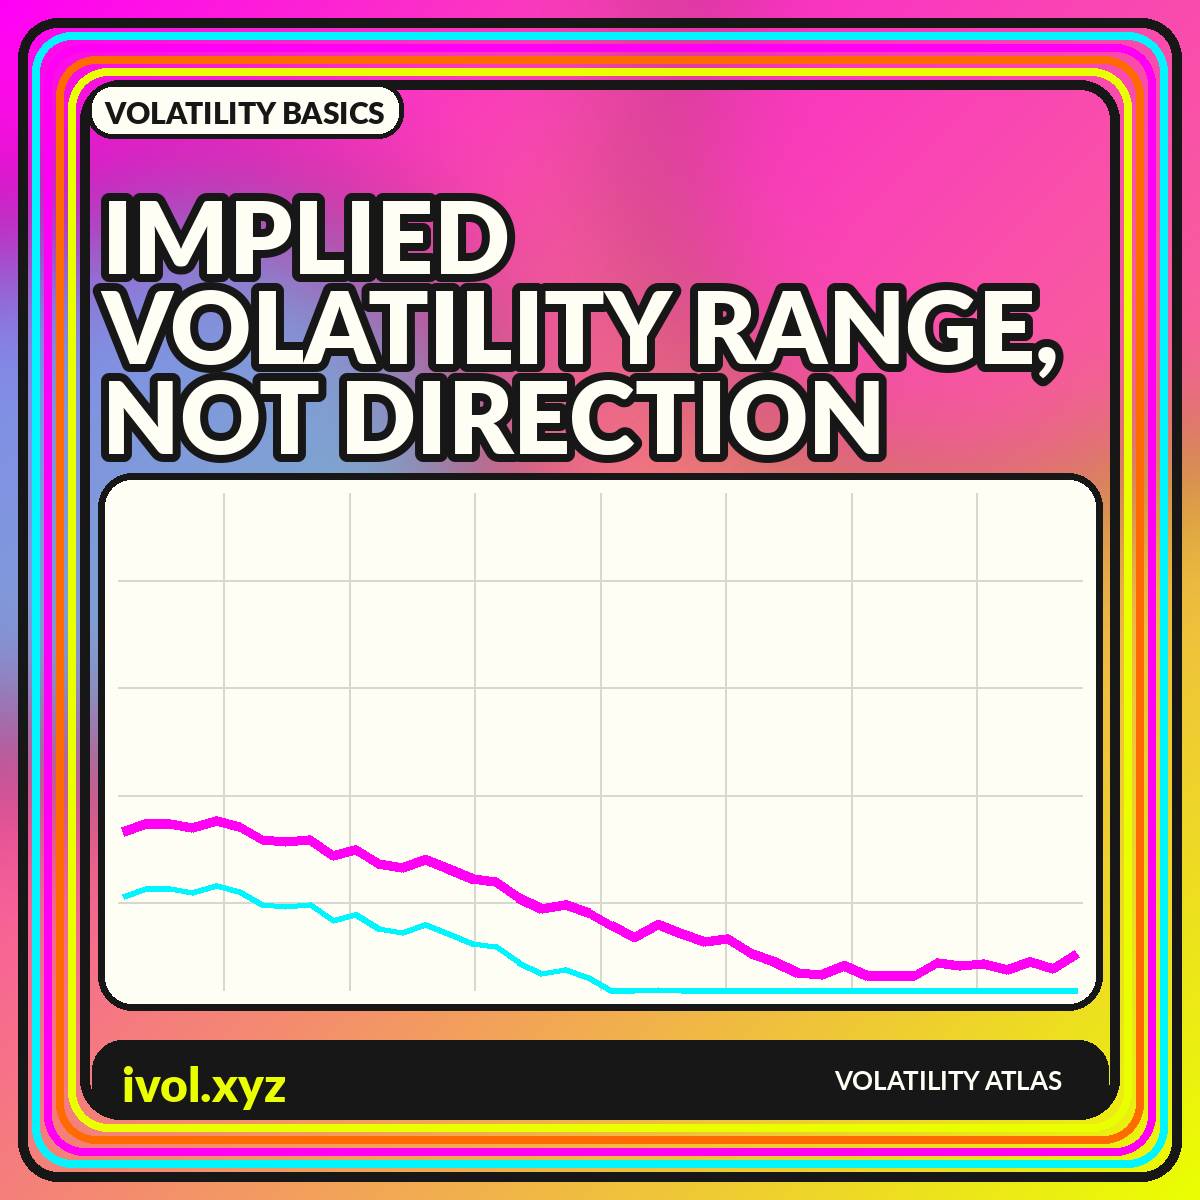
A chart-first guide to what implied volatility says, what it leaves unsaid, and how to compare it across expirations, strikes, and market regimes.